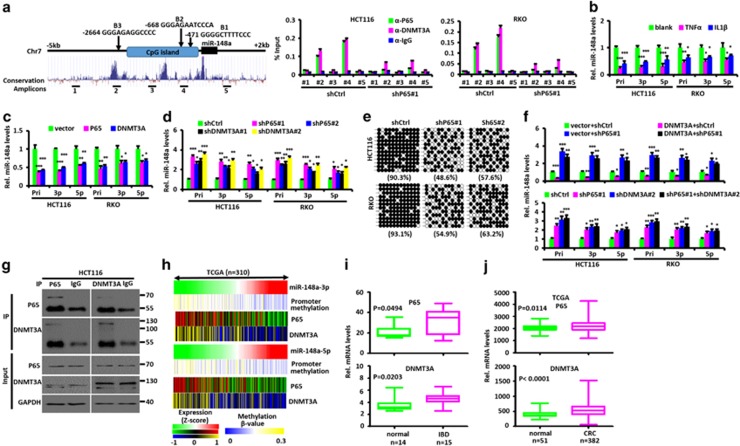
Figure 7.
P65 and DNMT3A regulate miR-148a expression. (a) Left: Schematic diagram showing the location of NF-κB-binding sites (B1-B3) in the miR-148a promoter. 1–5 are amplicons of ChIP-PCR. Right: quantitative PCR ChIP analyses of P65 and DNMT3A binding to different miR-148a promoter regions in HCT116 and RKO CRC cells transfected with shP65 or shCtrl vectors. (b) Effects of TNFα and IL1β treatment on the expression of endogenous miR-148a and miR-148a-3p/5p in HCT116 and RKO CRC cells. (c) Effects of ectopic P65 and DNMT3A expression on the expression of endogenous Pri-miR-148a and miR-148a-3p/5p in HCT116 and RKO CRC cells. (d) Effects of P65 and DNMT3A inhibition on the expression of endogenous Pri-miR-148a and miR-148a-3p/5p in HCT116 and RKO CRC cells. (e) Alterations in DNA methylation around the miR-148a promoter region were determined by bisulfite genomic sequencing in HCT116 and RKO CRC cells with or without P65 inhibition. PCR products were cloned into a TA cloning vector and 12 randomly selected clones were sequenced. Each row represents a single cloned allele. Filled circles, methylated CpG; open circles, unmethylated CpG. The percentage of methylated CpG sites is shown for each analysis. (f) P65 is necessary for DNMT3A-mediated Pri-miR-148a suppression. Pri-miR-148a and miR-148a-3p/5p RNA levels were normalized for U6 and were measured by stem-loop reverse transcription quantitative-PCR in RNA purified from HCT116 and RKO CRC cells stably expressing exogenous DNMT3A or inhibition of endogenous DNMT3A with or without P65 inhibition. (g) Co-IP of endogenous P65 and DNMT3A from HCT116 CRC cells. (h) The relation among miR-148a promoter methylation, miRNA level of miR-148a-3p/5p, mRNA level of P65 and DNMT3A expression in 310 CRC samples from TCGA data set is shown in a clustered heatmap. A vertical branch shows the expression or promoter methylation pattern of the selected miRNAs or genes in each CRC sample from TCGA data set. (i) P65 and DNMT3A mRNA expression in human IBD and normal colon tissues. (j) P65 and DNMT3A mRNA expression in normal colon and CRC tissues from TCGA data sets. (i and j) Significance was performed using Wilcoxon signed-rank test. Data present mean±S.D. in panels (a, b, c, d and f). *P<0.05, **P<0.01, ***P<0.001

