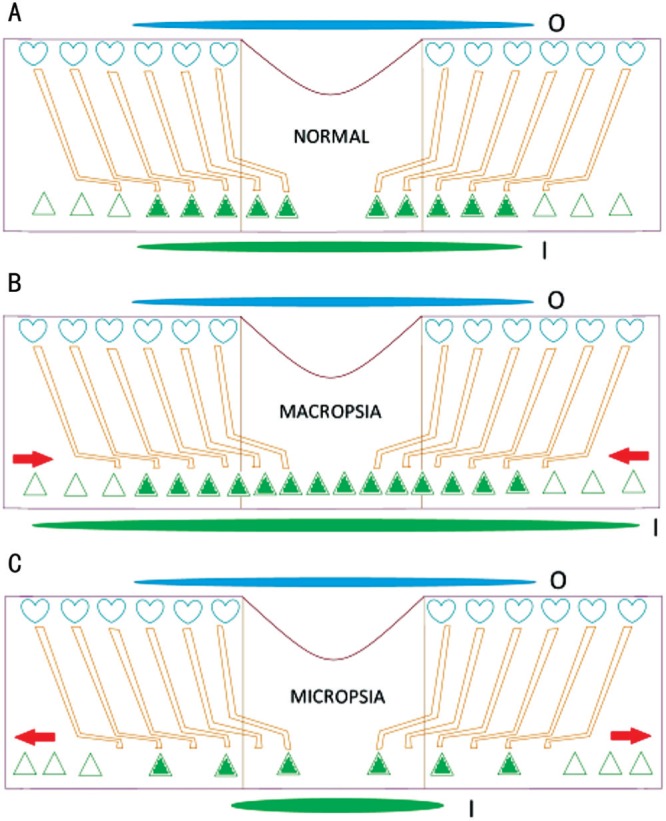
Figure 1. Schematic of the fovea explaining how a compressed and stretched macula can theoretically induce macropsia (B) and micropsia (C), respectively.

Changes in cone cell locations, object size, and image size are shown. The elongated blue and green ovals represent actual object size and perceived image size, respectively. Hearts represent Müller cell endfeet and triangles represent cones (A). Filled triangles represent light-stimulated cones. Red arrows show the direction of outer retinal movement. I: Image size; O: Object size.
