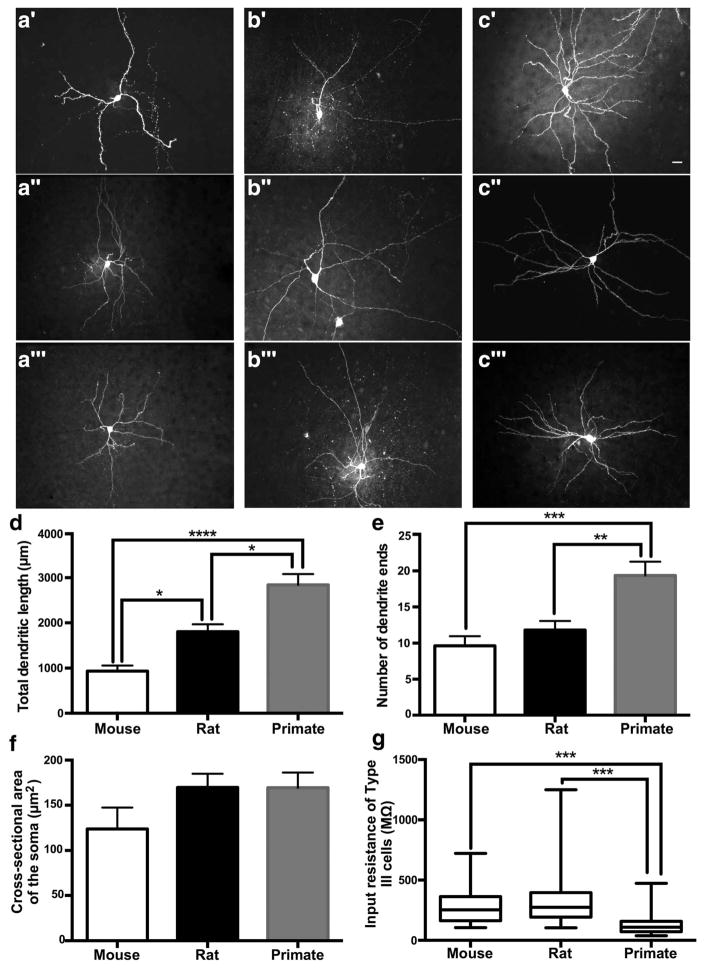
FIGURE 6.
Neuronal morphology and input resistance of mouse, rat, and primate cells in the BNST. Example maximum projections of z-stack images cells from the mouse (a′–a‴), rat (b′–b‴), and primate (c′–c‴) BNST (white scale bar is 20 μm). Plot of the total dendritic length (d), number of dendrite ends (e), area of the cell body (f), and input resistance of Type III cells (g). Scale bars are SEM. *p <.05, **p <.01, ***p <.001, ****p <.0001

