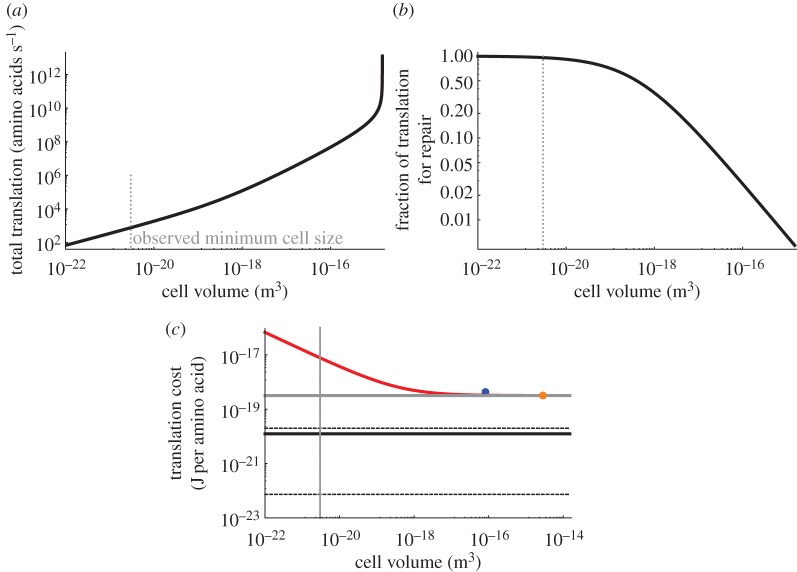
Figure 4.
(a) The total translation rate as a function of bacterial cell volume. The smallest observed bacterial species is indicated with the dotted grey line. (b) The fraction of translation activity that is dedicated to repairing damaged proteins. (c) The useful translation cost, defined as the total energy expended on all translation divided by the number of proteins synthesized for replication rather than for the repair of damage. The red curve is bacteria, the blue point is for unicellular eukaryotes and the orange point is a single mammalian cell. The black curve is the Landauer bound for translating a protein scaled to a single amino acid addition, and the grey curve is the known energetic cost per amino acid for a single ribosome given the ATP costs. The dashed black lines are the range of Landauer estimates given different accountings of the entropy discussed in the text. For example, the upper dashed line is the case where every amino acid is distinguishable. The discrepancy between the red and grey curves at the small end of bacteria is the result of the high fraction of total translation spent on repair for the smallest cells as shown in (b).

