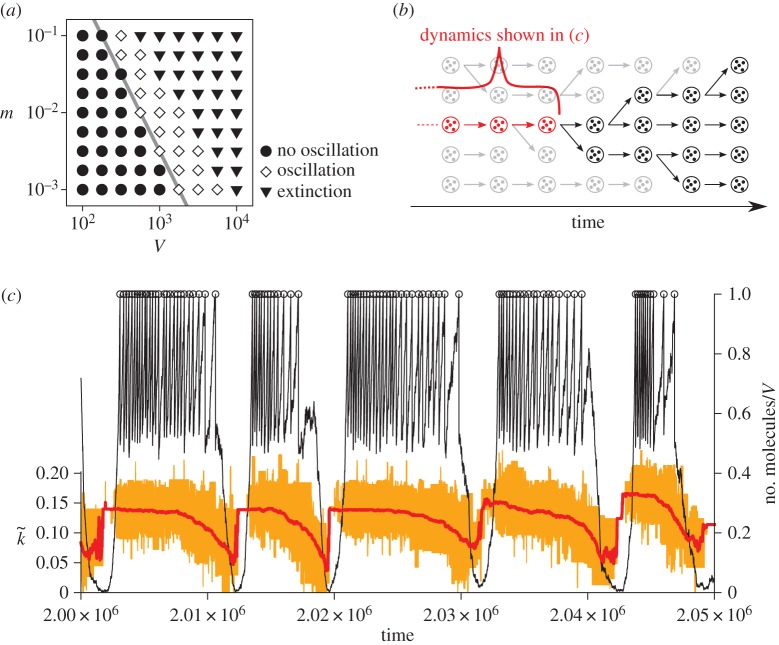
Figure 3.
(a) Phase diagram of the protocell model with respect to m (mutation rate) and V (a protocell divides when the number of its internal molecules exceeds V). The boundary between the parameter regions where the oscillation occurs (diamonds) and where it does not occur (filled circle) has approximately the same slope as that of mV ∝1/V (grey line). (Reproduced from Takeuchi et al. [36].) (b) Schematic of ancestor tracking (the method employed to obtain the data plotted in (c). A circle enclosing dots denotes a protocell. Ancestor tracking detects the lineage of the common ancestors of all surviving protocells (red). The dynamics of this lineage along its line of descent is plotted in (c). Extinct lineages are in grey. (c) The oscillatory dynamics of a protocell lineage along its line of descent (see also (b)). The displayed lineage was the common ancestors of a population at time 2.5×10⁶. Colour coding: the number of molecules in a protocell normalized by V (thin black line); cell division (open circle); the average catalytic activity of molecules within a protocell  (thick red line); the range of catalytic activities of molecules within a protocell (orange region around
  ). V =1000, m=0.01. (Reproduced from Takeuchi et al. [36].) (Online version in colour.)

