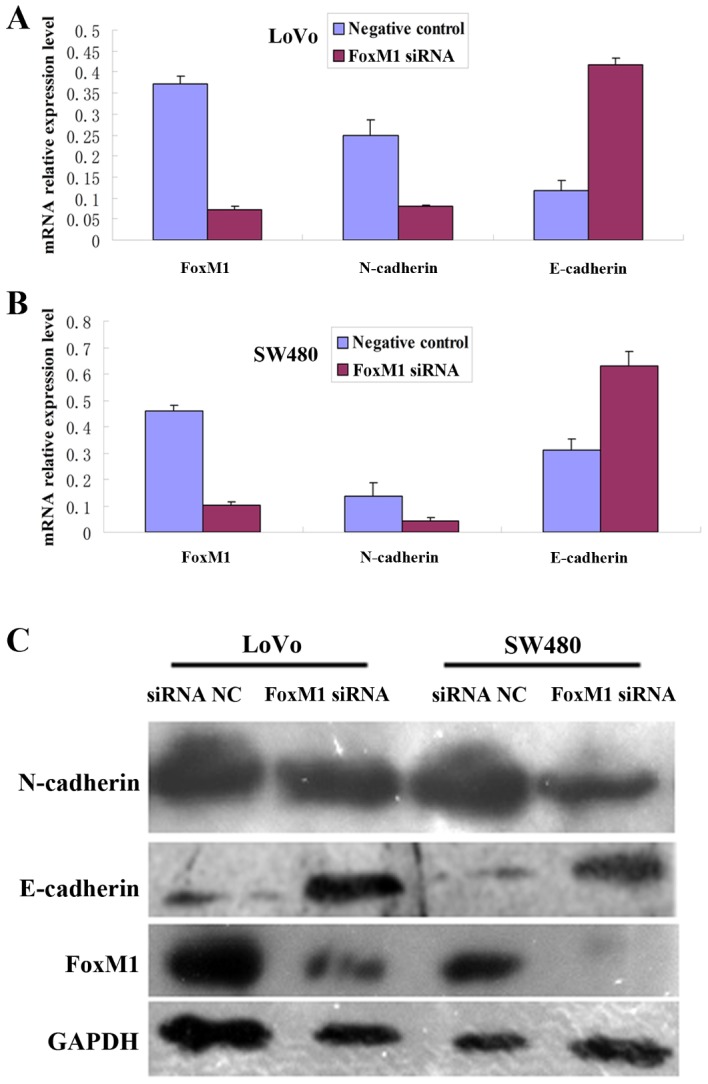
Figure 7.

Inhibition of FoxM1 using siRNA decreases FoxM1 and N-cadherin, and increases E-cadherin, protein and mRNA expression levels compared with NC siRNA transfection. mRNA expression levels were determined using the quantitative polymerase chain reaction, and protein levels were determined using western blot analysis. GADPH was used as a loading control. (A) mRNA expression in SW480 cells. (B) mRNA expression in LoVo cells. (C) Protein expression in LoVo and SW480 cells. FoxM1, forkhead box M1; siRNA, small interfering RNA; N-cadherin, neuronal cadherin; E-cadherin, epithelial cadherin; NC, negative control.
