Figure 3.
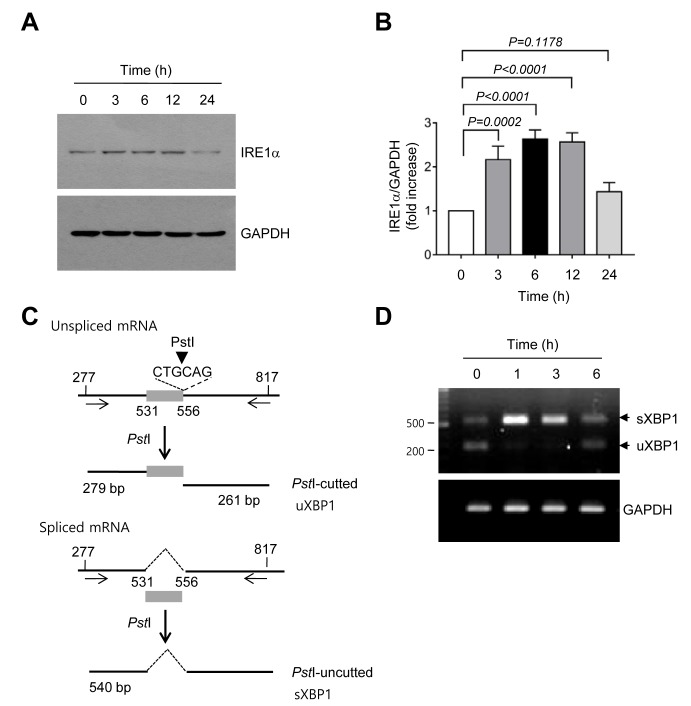
Effect of TCS7010 on the activation of the unfolded protein response signaling pathway. (A) HCT116 cells were treated with 5 µM TCS7010 for various time periods (0–24 h). Whole-cell lysates were subjected to immunoblotting using an antibody directed against IRE1α. GAPDH was used as an internal control. (B) Immunoblot band intensities were analyzed using a quantitative scanning densitometer. Vehicle (DMSO)-treated band intensity was set to 1 and the relative values of fold-increase were plotted as the mean ± standard deviation (n=3). Statistical analysis was performed using analysis of variance followed by Sidak's multiple comparisons test. (C) Schematic presentation of XBP-1 splicing. Numbers denote nucleotide positions with the transcription start site set at 1. The box indicates the 26-nt intron site (nt 531–556). The arrows indicate the RT-PCR primer positions. The arrowhead indicates the position of the PstI restriction enzyme. (D) HCT116 cells were treated with 5 µM TCS7010 for various time periods (0–6 h). Subsequently total RNA was isolated, XBP-1 mRNA splicing was determined using RT-PCR. GAPDH was used as an internal control. RT-PCR, reverse transcription-polymerase chain reaction; XBP1, X-box binding protein 1; s, spliced; u, unspliced; IRE1α, inositol-requiring enzyme 1α.

