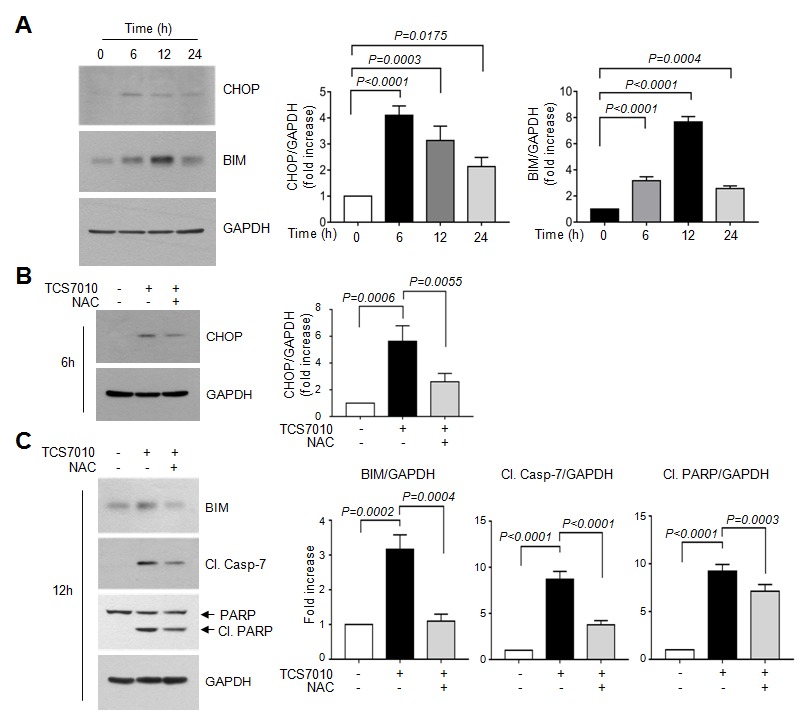
Figure 4.

Effect of TCS7010 on the upregulation of CHOP and BIM proteins. (A) HCT116 cells were treated with 5 µM TCS7010 for various time periods (0–24 h). Whole-cell lysates were subjected to immunoblotting using antibodies directed against CHOP and BIM. GAPDH was used as an internal control. Immunoblot band intensities were analyzed using a quantitative scanning densitometer (right graph). Vehicle (DMSO)-treated band intensity was set to 1 and the relative values of fold-increase were plotted as the mean ± standard deviation (n=3). Statistical analysis was performed using analysis of variance followed by Sidak's multiple comparisons test. HCT116 cells were treated with 5 µM TCS7010 for (B) 6 h or (C) 12 h in the absence or presence of 2 mM NAC. Whole-cell lysates were subjected to immunoblotting. GAPDH was used as an internal control. Immunoblot band intensities were analyzed using a quantitative scanning densitometer (right graph). Vehicle (DMSO)-treated band intensity was set to 1 and the relative values of fold-increase were plotted as the mean ± SD (n=3). Statistical analysis was performed using analysis of variance followed by Sidak's multiple comparisons test. Cl., cleaved; Casp, caspase; NAC, N-acetylcystein.
