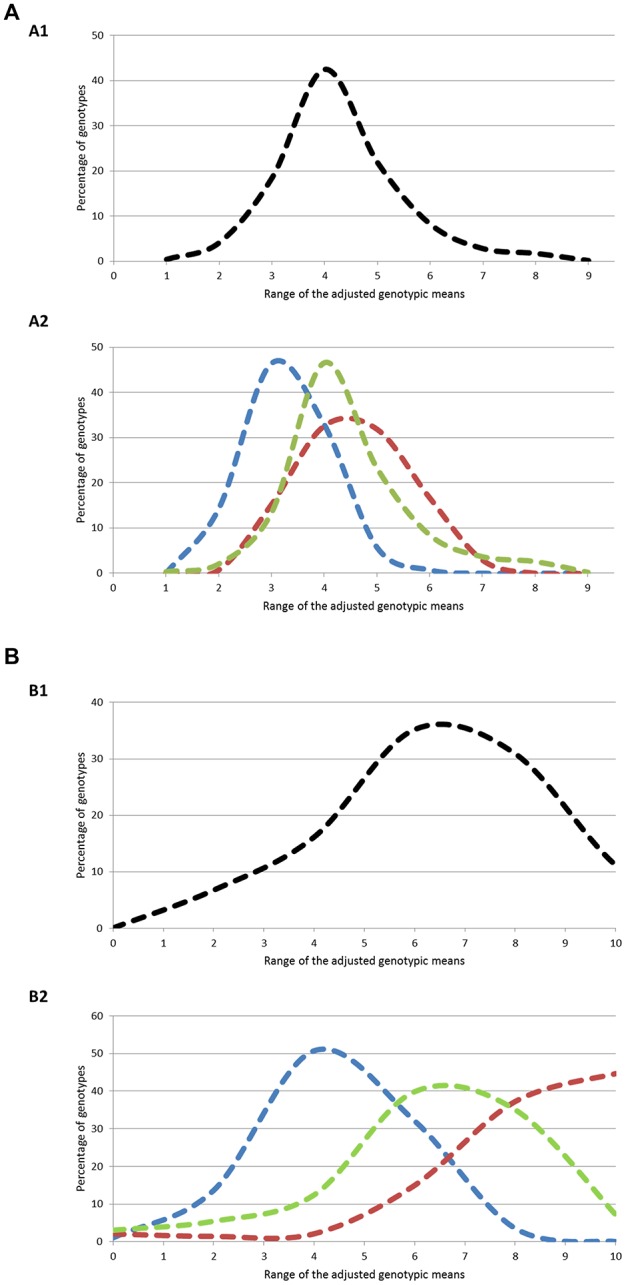
Figure 1.

(A) Distribution of the genotypes according to ranges of genotypic means on flowering period at two different levels: (A1) Whole population; (A2) Geographic groups. The three geographic groups are depicted using the following color codes: Blue = North+East group; Green = West group; Red = South group. (B) Distribution of the genotypes according to ranges of genotypic means on ripening period at two different levels: (B1) Whole population; (B2) Geographic groups. The three geographic groups are depicted using the following color codes: Blue = North+East group; Green = West group; Red = South group.
