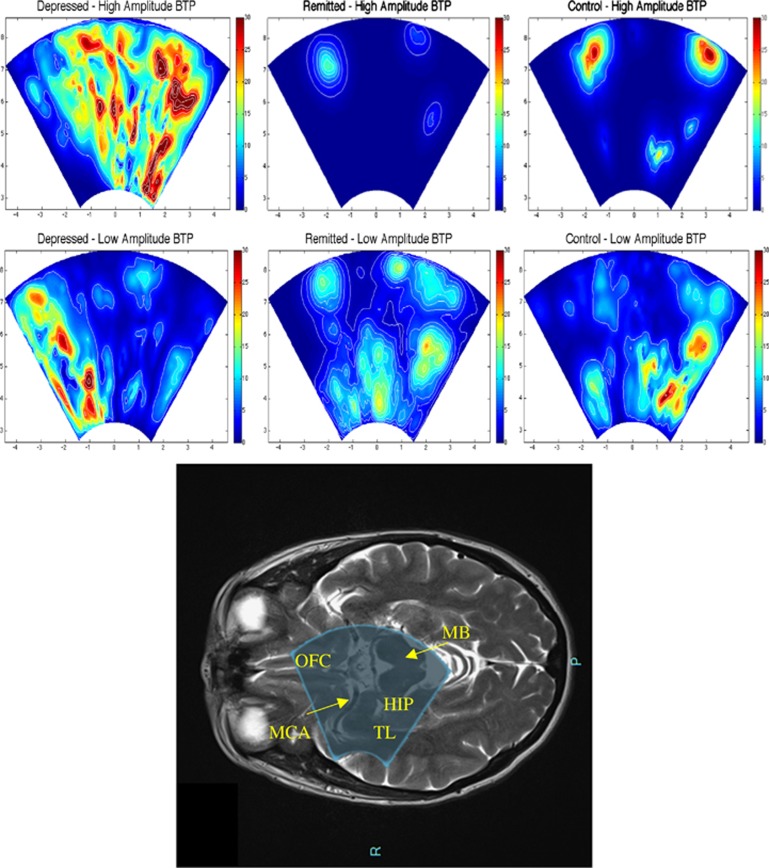
Figure 2.
Brain tissue pulsatility (BTP) color maps from three representative subjects of each group and picture of the ultrasound beam of the TPI overlaid on a MRI axial image. We filtered BTP matrixes with a threshold equal to 50% of the MaxBTP of the depressed subject to distinguish between high- and low-amplitude BTP, shown, respectively, at the top and bottom of the figure. We also applied the Horn—Schunck method to estimate the optical flow and displacement speed of each volume in the region of acquisition, the color maps of which show maximum values. Depressed subjects (left) exhibit more distributed high BTP compared with remitted (center) and control (right) subjects, who, in contrast, exhibit very localized high BTP, probably around the main large arteries of the circle of Willis. Low BTP appears to be similarly distributed in each of the three subjects in various small regions, possibly corresponding to small vessels. These maps suggest that high brain pulsatility, normally limited to large vessels in remitted and control subjects, affects the whole brain in depressed patients, consistently with our result of a higher MeanBTP in depressed patients. As shown on the bottom figure, the ultrasound beam of the TPI overlays parts of the temporal lobes (including parts of the hippocampus), the orbitofrontal cortex and the brainstem (midbrain). Hip: hippocampus; MB: midbrain; MCA: middle cerebral artery; OFC: orbitofrontal cortex; TL: temporal lobe.

