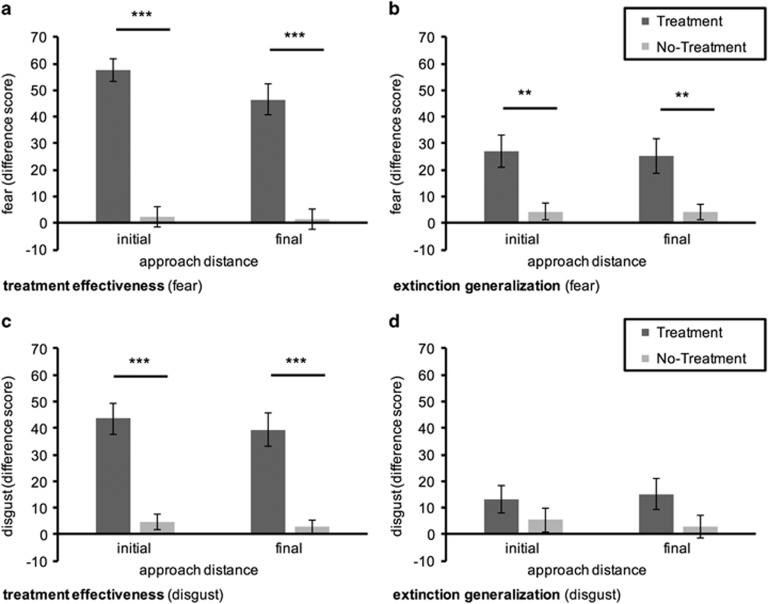
Figure 3.
Represents the reduction in fear (top; a and b) and disgust (bottom; c and d) from pre- to post-assessment (difference score) at the initial and final approach distance, separately for treatment effectiveness (left; a and c) and extinction generalization (b and d). Greater scores correspond to greater reduction from pre-to post-assessment. Scores are displayed as Means±1 SEM. ***P<0.001, **P<0.01.

