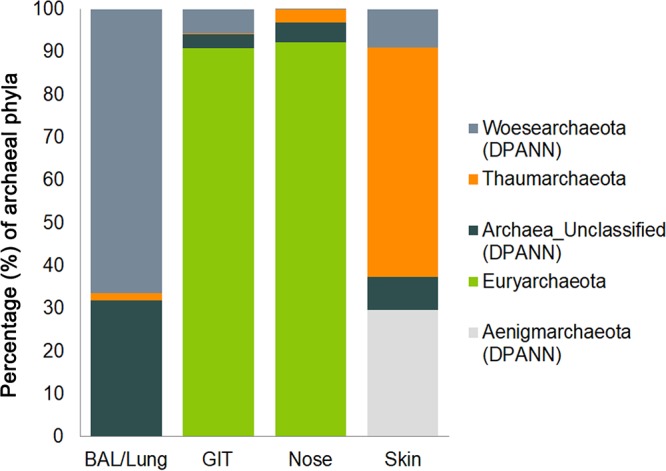
FIG 3 .

Archaeal composition at the phylum level in BAL fluid/lung, gut, nasal, and skin samples. The bar chart shows the relative abundance (percent) of the archaeal phyla in samples taken from different body sites. The different phyla are indicated by different colors, as shown on the right. DPANN archaeal signatures are shown in different shades of gray.
