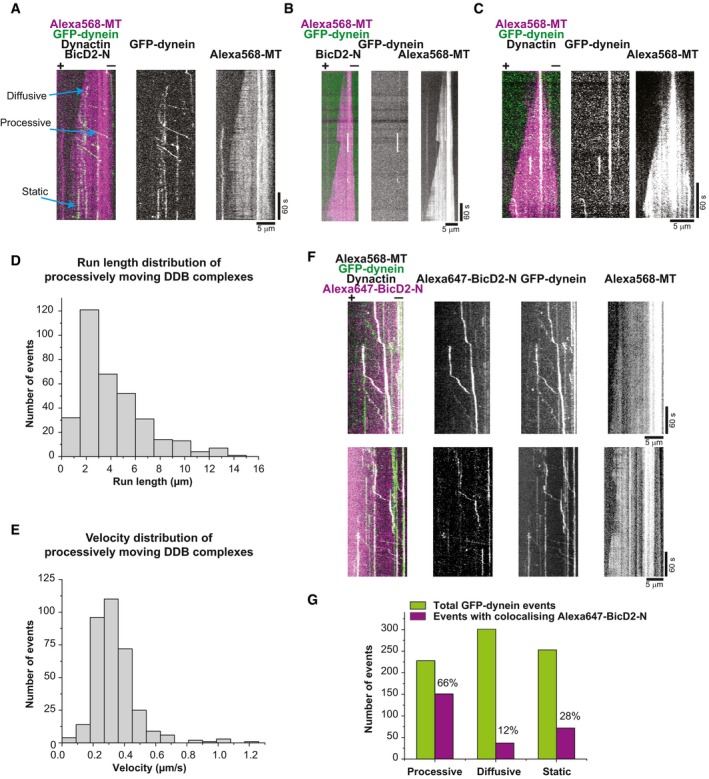
Figure EV3. Dynein motility in the presence of dynactin and BicD2‐N on dynamic microtubules (related to Fig 2).

-
ADual and single colour TIRF microscopy kymographs depicting GFP‐dynein motility (green in merge) on dynamic Alexa568‐microtubules (magenta in merge). Concentrations were 10 nM GFP‐dynein, 20 nM dynactin, 200 nM BicD2‐N and 17.5 μM Alexa568‐tubulin.
-
B, CKymographs showing GFP‐dynein behaviour in the absence of (B) BicD2‐N or (C) dynactin; other conditions as in (A).
-
DHistogram of the run length distribution of processively moving DDB complexes (n = 343 complexes from three separate experiments). The mean run length is 4.1 ± 0.15 (s.e.m.) μm.
-
EHistogram of the velocity distribution of processively moving DDB complexes (n = 343 complexes). The mean velocity is 0.34 ± 0.01 (s.e.m.) μm/s.
-
FDual and single colour kymographs showing preferential colocalisation of GFP‐dynein (green in merge) and Alexa647‐BicD2‐N (magenta in merge) during processive motility in the presence of dynactin on dynamic Alexa568‐microtubules (not shown in merge). Protein concentrations were 10 nM GFP‐dynein, 20 nM human dynactin, 200 nM Alexa647‐BicD2 and 17.5 μM Alexa568‐tubulin. Microtubule orientation as indicated.
-
GQuantification of the number of observed GFP‐dynein (green bars) and Alexa647‐BicD2‐N (magenta bars) events in the three categories “processive motility”, “diffusion” and “static binding” and the percentage of events with colocalising BicD2‐N in each category. Protein concentrations as in (F). Most colocalisation was observed for processive motility events (n = 788 complexes from two separate experiments).
