
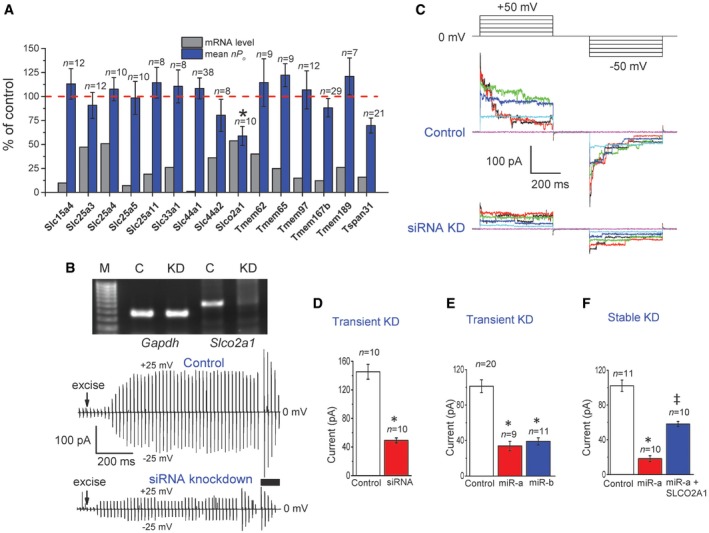
Figure 2. Silencing of the expression of SLCO2A1 gene downregulates Maxi‐Cl activity in C127 cells.
-
ARelative changes in the levels of mRNA and activity of Maxi‐Cl in inside‐out patches (mean nP o values are presented as the % of control) excised from C127 cells after siRNA‐mediated silencing for 15 targeted genes. Error bars, SEM, *P < 0.05 by Student's t‐test.
-
BThe expression of Slco2a1 mRNA detected by RT–PCR (top panel) and time courses of excision‐induced activation of Maxi‐Cl currents (lower panels). The Gapdh‐normalized signal of Slco2a1 in siRNA‐treated cells is 20 ± 7% of Control (n = 4).
-
CMaxi‐Cl activity in Control and siRNA‐treated cells after full activation (thick bar in B). The currents were elicited by step pulses from +50 mV to −50 mV in 10‐mV increments (pulse protocol shown at the top).
-
D–FMean patch currents at +25 mV in Control (n = 10, 20, and 11 for D–F, respectively) and Slco2a1‐targeting siRNA‐treated cells (D, n = 10), in cells treated with two different microRNAs, miR‐a (n = 9) and miR‐b (n = 11) (E), and in cells stably transfected with miR‐a alone (n = 10) and with miR‐a plus microRNA‐insensitive SLCO2A1 (n = 10) (F). The data from three to four different transfections for each value are pooled. Error bars, SEM. *P < 0.05 vs. Control, ‡ P < 0.05 vs. miR‐a. Student's t‐test is used for (D) and ANOVA for (E and F).
Source data are available online for this figure.