
Figure EV3. Gd3+ and BSP sensitivity of non‐Maxi‐Cl channels in SLCO2A1‐deficient cells.
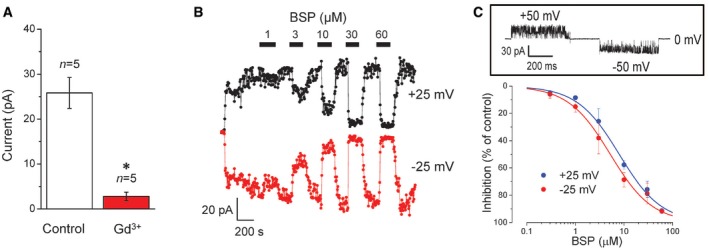
- Mean patch currents recorded at +25 mV in the outside‐out mode in the absence (Control: white column) and presence of Gd3+ (50 μM: red column) in the bath solution. Error bars, SEM, *P < 0.05 (Student's t‐test). n = 5 (from different cells) for Control and Gd3+.
- Dose‐dependent inhibitory effects of BSP (added at bars) on currents recorded from an inside‐out patch in response to a step‐pulse of ±25 mV applied every 5 s. Result of the representative experiment is shown.
- Concentration–response curves of BSP effects with IC50 = 8.3 ± 1.7 μM at +25 mV and 5.2 ± 0.4 μM at −25 mV. The inset on top shows flickery currents observed in the presence of 3 μM BSP. n = 5 for each data point (from five different experiments as shown on panel B). Error bars, SEM.