
Figure 4. CRISPR/Cas9‐mediated gene disruption eliminates Maxi‐Cl activity in C127 cells.
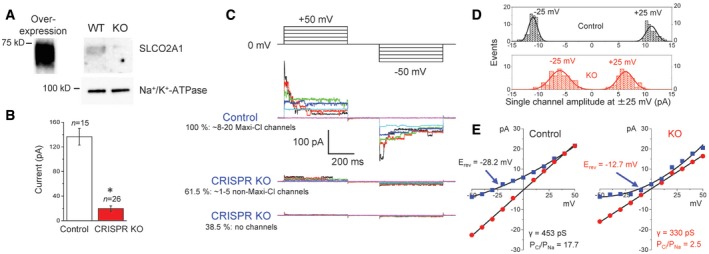
- Western blotting with anti‐SLCO2A1 antibodies; the ˜70‐kDa band is present in SLCO2A1‐overexpressing HEK293T and wild‐type (WT) C127 cells but absent in knockout (KO) C127 cells generated by the CRISPR/Cas9 technology. The data represent duplicate experiments.
- Mean patch currents at +25 mV in WT (Control) and KO cells. n = 15 for Control and 26 for CRISPR KO observed from different cells. Error bars, SEM, *P < 0.05 (Student's t‐test).
- The activity of Maxi‐Cl in Control and KO cells. Two representative records for KO correspond to two populations with no channel activity (bottom traces) and greatly reduced activity of different channels (middle traces).
- Single‐channel amplitude histogram in Control and KO cells. The distributions are significantly different at P < 0.05, as assessed by Kolmogorov–Smirnov test.
- I–V relationships for Maxi‐Cl activity in Control cells (left panel) and newly emerging channel events in KO cells (right panel). Circles: Bath and pipettes contained normal Ringer solution; squares: pipettes contained Ringer, and bath contained (in mM) 30 NaCl, 2 CaCl2, 1 MgCl2, 5 Na‐HEPES, 6 HEPES, and 240 mannitol. n = 7–29 (Control) and n = 3–38 (KO) from five to nine different patches.
Source data are available online for this figure.