
Figure 5. Overexpression of the SLCO2A1 mutant reduces the unitary amplitude and modifies voltage‐dependent gating of the Maxi‐Cl in C127 cells.
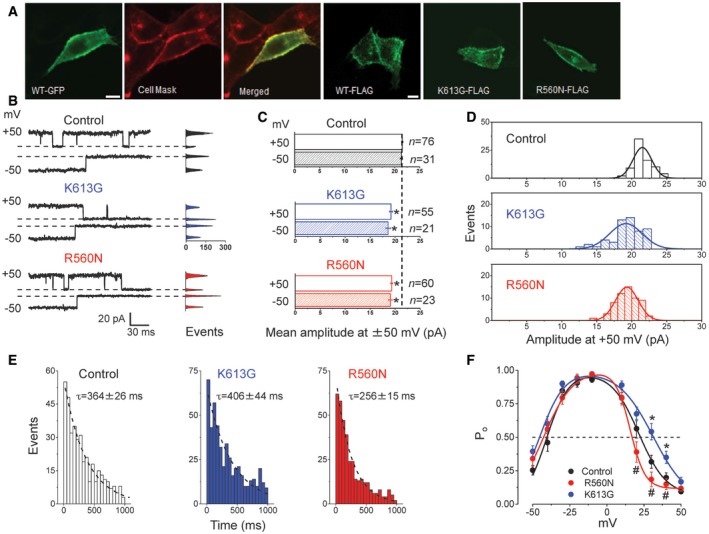
- Laser confocal images of live cells overexpressed with GFP‐tagged WT SLCO2A1 (first three images from the left) and of fixed cells overexpressed with FLAG‐tagged WT, K613G mutant, or R560N mutant proteins of SLCO2A1 (images four to six from the left). Scale bars, 10 μm. (See Appendix Table S2 for expression vectors used here.)
- Representative single‐channel events recorded at ±50 mV from mock‐transfected Control cells and cells transfected with the K613G or R560N mutant. Respective all‐points histograms are shown on the right of each trace; dashed lines correspond to the respective zero‐current level.
- Average single‐channel amplitudes recorded at +50 mV (empty bars) and −50 mV (hatched bars) in these cells. Error bars, SEM. *P < 0.05 (Student's t‐test). n = 76 and 31 for Control, n = 55 and 21 for K613G, and n = 60 and 23 for R560N at +50 mV and −50 mV, respectively. The data from at least five different patches are pooled.
- Single‐channel amplitude histogram in mock‐transfected Control cells and in cells transfected with the K613G or R560N mutant. The total number of events is indicated on the respective bars in (C). The distributions for mutant‐transfected cells are significantly different from that in Control as assessed by ANOVA with a Bonferroni correction (P = 5.8 × 10⁻¹² and P = 2.4 × 10⁻¹¹ for K613G and R560N vs. Control, respectively).
- Distribution of the first latency time (a time from the onset of a +50 mV test pulse and channel closure) for Maxi‐Cl in mock‐transfected Control cells (n = 388) and in cells transfected with the K613G (n = 498) or R560N (n = 370) mutant. Dashed lines are single‐exponential fits with indicated time constants. The distribution for R560N is different from that of Control and from that of K613G at P < 0.05, as assessed by nonparametric Kolmogorov–Smirnov test.
- Voltage dependence of open probability for Maxi‐Cl in mock‐transfected Control cells and in cells transfected with the K613G or R560N mutant. Error bars, SEM. *P < 0.05 between Control and K613G; # P < 0.05 between R560N and K613G; n = 14−20 for five different patches, tested by ANOVA.