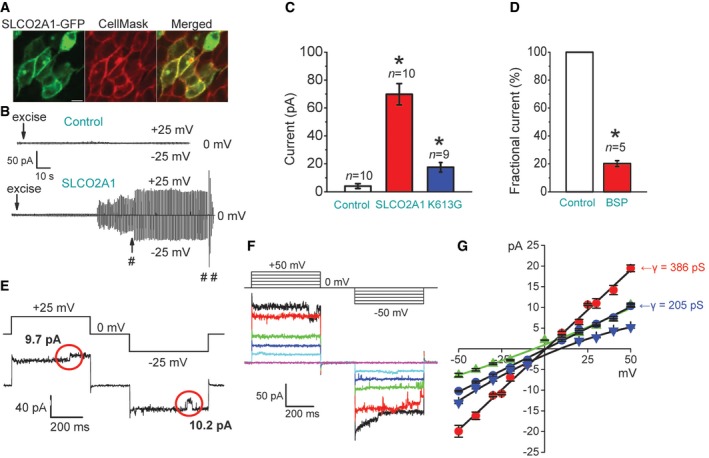
Plasma membrane expression of the recombinant GFP‐tagged SLCO2A1 protein in transfected cells stained with CellMask™ Orange Plasma Membrane Stain (CellMask) and observed under a laser confocal microscope; scale bar, 10 μm.
Time courses of the currents recorded in cells after control mock transfection (upper trace) and after overexpression of Slco2a1 (lower trace). Symbols # and ## indicate the time points at which the currents shown in (E) and (F), respectively, were recorded.
Mean patch currents recorded at +25 mV in control mock‐transfected, Slco2a1‐transfected, and K613G‐transfected cells. Error bars, SEM, *P < 0.05 (ANOVA). n = 10 for Control (from four different mock transfections) and n = 10 for SLCO2A1 (from four different gene transfections), and n = 9 for K613G (from five different gene transfections). Only patches displaying current activation were counted (the total number of tested patches is 25 for WT and 17 for mutant).
Effect of BSP (50 μM) on the mean patch currents recorded at +25 mV in Slco2a1‐transfected cells. The result is expressed as a fractional current relative to the control level recorded immediately before application of the drug. Error bars, SEM, *P < 0.05 (Student's t‐test). n = 5 from different cells.
Single Maxi‐Cl events recorded in Slco2a1‐transfected cells. The red circles mark stepwise channel events with large amplitudes.
Maxi‐Cl activity recorded upon application of step pulses (protocol shown at the top) after full current activation in a macro‐patch excised from Slco2a1‐transfected cells.
I–V relationship of single‐channel currents recorded in inside‐out patches excised from cells after overexpression of WT SLCO2A1 or K613G. The slope conductance (γ) is 386 ± 7 pS for WT SLCO2A1 (red circles) and 205 ± 5 pS for K613G (blue circles) under symmetrical NaCl‐rich conditions. The reversal potential was shifted in a positive direction when the NaCl concentration in bath Ringer solution was reduced from 150 to 30 mM (blue triangles), but it was shifted in a negative direction when pipettes were filled with NMDG‐Ringer solution (green triangles). Each symbol represents the mean of 3–7 observations obtained from five different patches. Error bars, SEM.