-
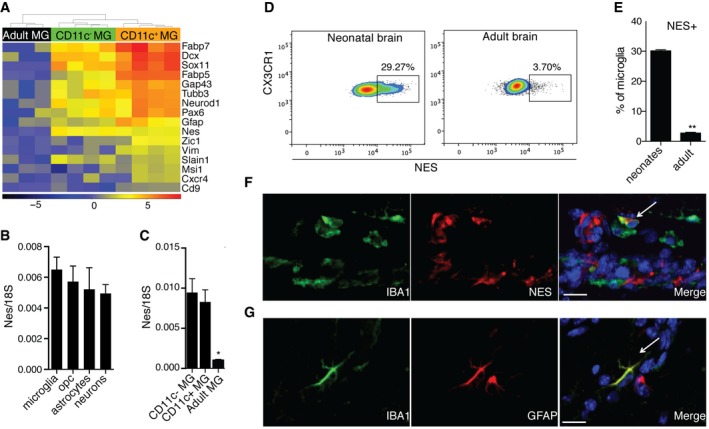
A
A heatmap showing neuroectodermal gene expression in neonatal versus adult microglia. Scale represents log2 fold change normalized CPM expression values.
-
B, C
Expression of nestin in MACS‐sorted microglia (n = 4), OPC (n = 4), astrocytes (n = 4), and neurons (n = 3) from brains of PN3‐7 mice (B) as well as FACS‐sorted CD11c+ microglia (n = 5), CD11c− microglia (n = 5) from brains of PN4‐7 mice, and total microglia from adult brain (C).
-
D, E
Representative flow cytometry profiles (D) and bar graph (E) showing nestin expression in microglia from brains of PN5 mice (n = 5) and adult mice (n = 6).
-
F, G
Confocal microscopic analysis showing co‐localization of nestin (red) (F) or GFAP (red) (G) with IBA1 (green) (n = 3). Arrows point to IBA1, NES (F) and IBA1, GFAP (G) double positive cells. Scale bars = 15 μm.
Data information: Data are based on at least two experimental repeats. Data are presented as means ± SEM; each
n represents an individual mouse.
P‐values were determined by two‐tailed Mann‐Whitney
U‐test. ns, not significant; *
P <
0.05; **
P <
0.01.