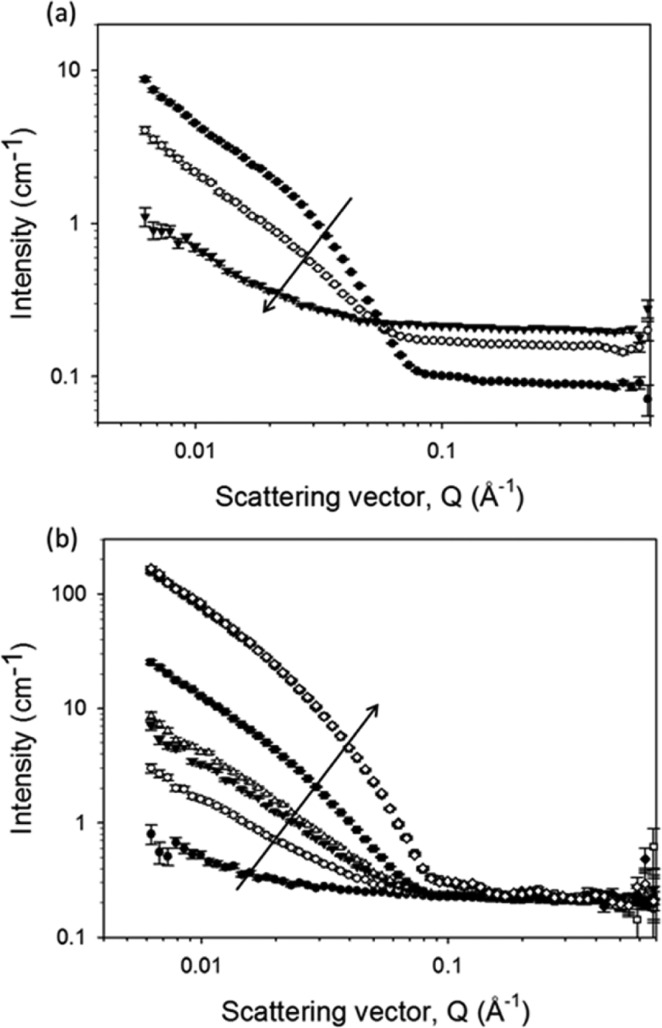
Figure 4.
Time-dependent SANS profiles of 2 while drying. The data have been split into plot (a) showing 0 h represented by filled circles, 4.2 h by open circles, and 8.3 h by filled triangles, when the overall scattering intensity was decreasing (with time, as shown by the arrow) and (b) showing 11.9 h represented by filled circles, 13.6 h by open circles, 15.2 h by filled triangles, 15.6 by open triangles, 18.3 h by filled squares, 24.0 h by open squares, 29.3 h by filled diamonds, and 33.2 h by open diamonds, when the scattering intensity began to increase again (with time, as shown by the arrow). The data for 24 h and beyond overlap each other completely. The data were normalized and background subtracted based on an extrapolated thickness assuming a linear rate of D2O loss from measurements at three time points.

