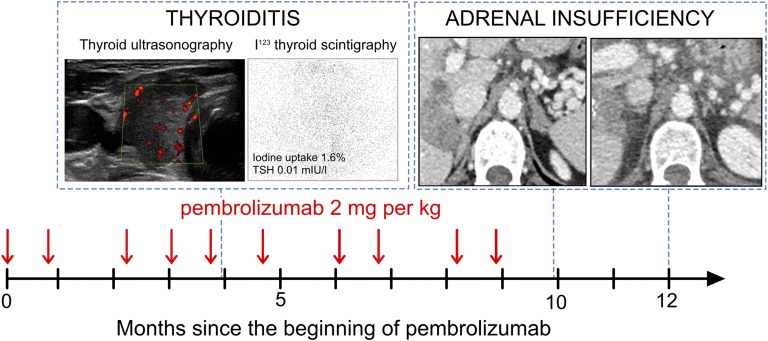
Figure 1.
Polyendocrinopathy secondary to pembrolizumab. The dark arrow represents the time in months since the introduction of pembrolizumab. The vertical red arrows represent pembrolizumab injections at a dose of 2 mg/kg. The first CT scan shows the adrenal glands at the time of diagnosis of adrenal insufficiency. The second CT scan shows the adrenal glands 2 months later. I123, iodine-123.

