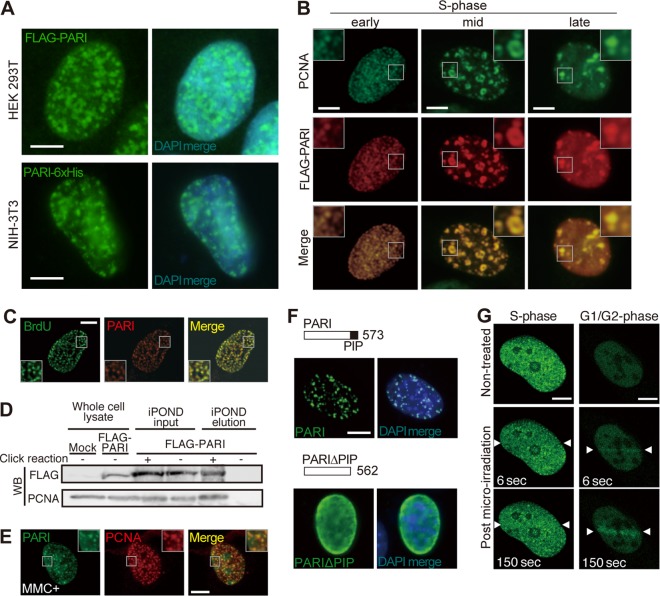
FIG 4.
PARI localization at replication forks and DNA damage sites. (A) HEK 293T (top) and NIH 3T3 (bottom) cells transiently transfected with pCAG-FLAG-PARI and pCAG-PARI-6×His plasmids were immunostained with anti-FLAG and anti-6×His antibodies, respectively. DAPI was used to visualize the nuclei. Scale bars, 5 μm. (B) NIH 3T3 cells transiently transfected with pCAG-FLAG-PARI immunostained for FLAG (red) and PCNA (green). Representative images of early, mid-, and late S phase cells are presented. The insets show higher-magnification views of the boxed regions. Scale bars, 5 μm. (C) NIH 3T3 cells transiently transfected with pCAG-FLAG-PARI and pulse-labeled with BrdU were stained with anti-FLAG (red) and anti-BrdU (green) antibodies. (D) iPOND analysis of 293T cells transfected with pCAG-FLAG-PARI and pulse-labeled with EdU. Nascent replication forks were captured by the click reaction, and FLAG-PARI and PCNA were detected by Western blotting (WB). The input lanes represent 2.4% of the cell lysates used for the iPOND elution. (E) NIH 3T3 cells transiently transfected with pCAG-FLAG-PARI were treated with MMC for 24 h and immunostained for FLAG (green) and PCNA (red). (F) NIH 3T3 cells transiently transfected with plasmids that express FLAG-tagged full-length PARI (top) or PIP box deletion mutant PARIΔPIP (bottom) constructs were stained with anti-FLAG antibody (green). Nuclei were counterstained with DAPI (blue). (G) U2OS cells transfected with a plasmid that expresses GFP-human PARI were laser irradiated (between arrowheads) during S phase (left) or G1/G2 phase (right), and live-cell imaging was carried out. Representative images at the indicated time points are shown. Scale bars, 5 μm.

