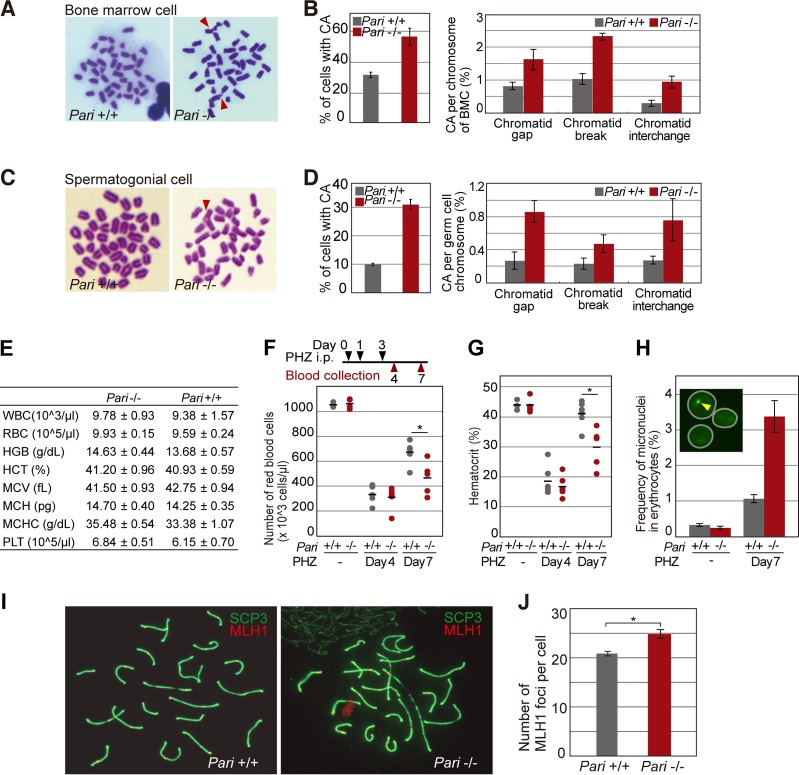
FIG 8.
Chromosome instability of Pari-deficient cells in response to replication stress in vivo. (A) Metaphase spreads (Giemsa) of bone marrow cells from Pari+/+ and Pari−/− mice injected with MMC (15 mg/kg). Chromosome aberrations are indicated with arrowheads. (B) Quantification (percentages) of chromosome aberrations in bone marrow cells from the experiment shown in panel A. Percentages of metaphase cells with chromosome aberrations (left) and each type of chromosome aberration (right) are shown. Means ± SE were obtained from >70 metaphases/sample from four pairs of Pari+/+ and Pari−/− mice. (C) Metaphase spreads (Giemsa) of spermatogonial cells from Pari+/+ and Pari−/− males injected with MMC (8 mg/kg). (D) Quantification (percentages) of chromosome aberrations in spermatogonial cells from the experiment shown in panel C. Percentages of metaphase cells with chromosome aberrations (left) and each type of chromosome aberration (right) are shown. Means ± SE were obtained from >70 metaphases/sample from three pairs of Pari+/+ and Pari−/− mice. (E) Hematological values in Pari+/+ and Pari−/− mice under standard housing conditions (means ± SE; n = 4). WBC, white blood cells; HGB, hemoglobin; HCT, hematocrits; MCV, mean corpuscular volume; MCH, mean corpuscular hemoglobin; MCHC, mean corpuscular hemoglobin concentration; PLT, platelets. (F and G) Numbers of red blood cells (F) and hematocrit values (G) of peripheral blood collected from Pari−/− and Pari+/+ mice treated (days 4 and 7) or not with intraperitoneal injections of PHZ (40 mg/kg) (n = 6). Each dot represents a single mouse, and the bars indicate the means. P = 0.81 (day 4) and P < 0.05 (day 7) (F) and P = 0.70 (day 4) and P < 0.01 (day 7) (G) (Mann-Whitney U test). (H) Frequencies of micronuclei in >2,000 erythrocytes in peripheral blood from Pari−/− and Pari+/+ mice treated (day 7) or not with PHZ. The data represent means ± SE (n = 3). (Inset) Representative image of erythrocytes (white circles) stained with acridine orange. The arrowhead indicates a micronucleus. (I) Surface spreads of meiotic spermatocytes from Pari+/+ and Pari−/− male mice immunostained for MLH1 (red) and SYCP3 (green). (J) Numbers of MLH1 foci (recombination nodules) on synaptonemal complexes (SYCP3) per spermatocyte from the experiment shown in panel I. Means ± SE from the results of three independent experiments are presented. Fifty spermatocytes were analyzed for each experiment. *, P < 0.001 (Mann-Whitney U test).

