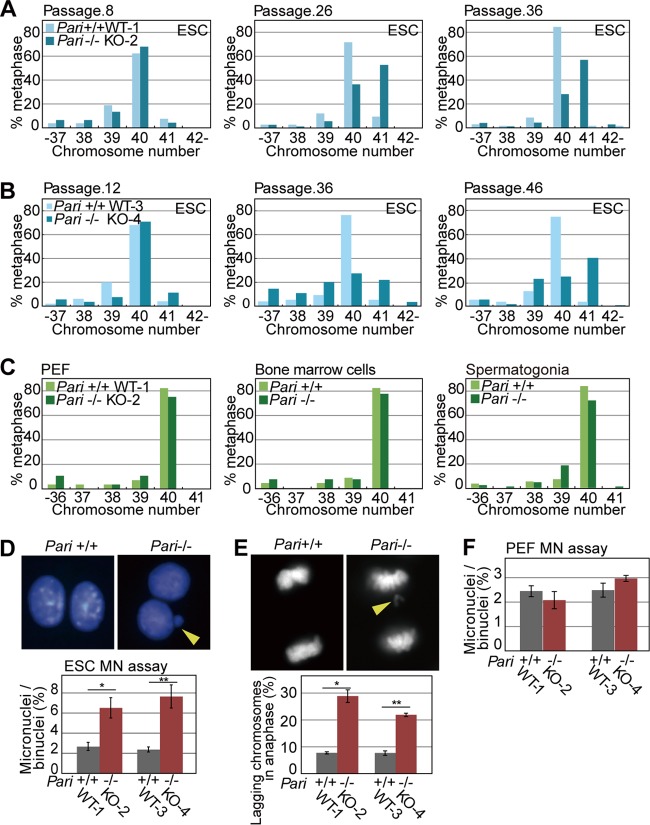
FIG 9.
Spontaneous chromosome instability in Pari-deficient ES cells. (A and B) Numbers of chromosomes in Pari+/+ and Pari−/− ES cell lines at early (left), middle (middle), and late (right) passages. Pari+/+ (WT-1) and Pari−/− (KO-2) (A) and Pari+/+ (WT-3) and Pari−/− (KO-4) (B) ES cell lines were established from two independent pairs of sibling blastocysts. (C) Numbers of chromosomes in PEF (left) obtained from Pari+/+ and Pari−/− embryos and in bone marrow cells (middle) and spermatogonial cells (right) obtained from Pari+/+ and Pari−/− mice. (D) Cytokinesis block micronucleus (MN) assay of Pari+/+ and Pari−/− ES cells. Representative images (top) and frequencies of micronuclei in >500 binuclei per sample (bottom) are shown. ES cell lines established from two independent pairs of sibling blastocysts (Pari+/+ [WT-1] versus Pari−/− [KO-2] and Pari+/+ [WT-3] versus Pari−/− [KO-4], as shown in panels A and B) were used for the experiment. The data are means ± SE (n = 4). *, P < 0.05; **, P < 0.05 (Mann-Whitney U test). The arrowhead indicates a micronucleus. (E) Lagging-chromosome assay of Pari+/+ and Pari−/− ES cells. Representative images (top) and frequencies of anaphase cells with a lagging chromosome(s) (bottom) are shown. Fifty anaphase cells were examined per sample. The data are means ± SE (n = 4). *, P < 0.05; **, P < 0.05 (Mann-Whitney U test). The arrowhead indicates a lagging chromosome. (F) Cytokinesis block micronucleus assay of Pari+/+ and Pari−/− PEF. Frequencies of micronuclei in >500 binuclei per sample are shown. PEF expanded from two independent pairs of Pari+/+ and Pari−/− embryos (WT-1 versus KO-2 and WT-3 versus KO-4) were used for the experiment. The data are means ± SE (n = 4). P = 0.49 and P = 0.34 (Mann-Whitney U test).

