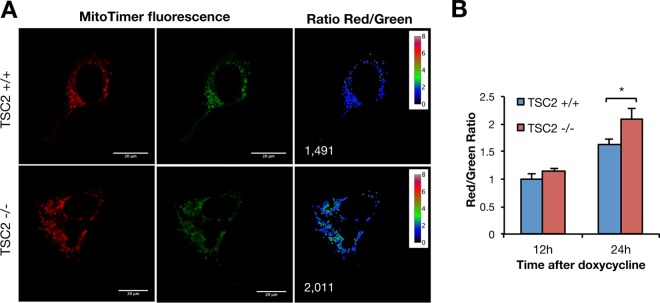
FIG 2.
TSC2-deficient cells show increased mitochondrial aging. (A) Representative images of TSC2+/+ and TSC2−/− MEFs, stably expressing rtTA3, transfected with the doxycycline-inducible MitoTimer probe and then pulsed with doxycycline prior to visualization after 24 h. Ratiometric images representing the red/green ratio (MitoTimer fluorescence shifts from green to red with time) are also shown; the value of the ratio is represented as intensity and color coded as indicated in the scales. The numbers represent the specific ratios of the images shown. (B) Quantification of the red/green ratios 12 and 24 h after doxycycline pulse. The values represent means and SD (n = 3 independent experiments). *, P < 0.05 compared to the indicated control.

