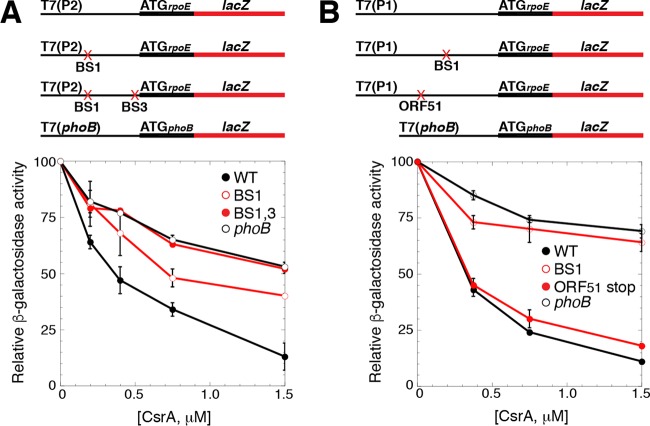
FIG 5.
CsrA represses translation of rpoE. (A and B) Schematic representations of the fusions used in this analysis are shown at the top. T7 RNAP drives transcription from the P2 (A) or P1 (B) transcription start sites. The start codon (ATG) driving the translation of each fusion is shown. The rpoE promoter and leader regions are depicted with a thin black line, while the rpoE and lacZ coding sequences are depicted with thick black and red lines, respectively. GGA motif mutations in BS1 and/or BS3, as well as an ORF51 stop codon mutant, are indicated with a red X. Relative β-galactosidase activity ± standard deviation as a function of CsrA concentration from at least three experiments was determined in vitro with PURExpress. A phoB′-′lacZ translational fusion was used as a negative control. (A) Expression of a WT T7(P2)-rpoE′-′lacZ translational fusion, as well as mutant fusions containing GGA-to-CCA mutations in BS1, or both BS1 and BS3. (B) Expression of a WT T7(P1)-rpoE′-′lacZ translational fusion, as well as mutant fusions containing a GGA-to-GCA mutation in BS1, or a stop codon mutation in codon 12 of ORF51.

