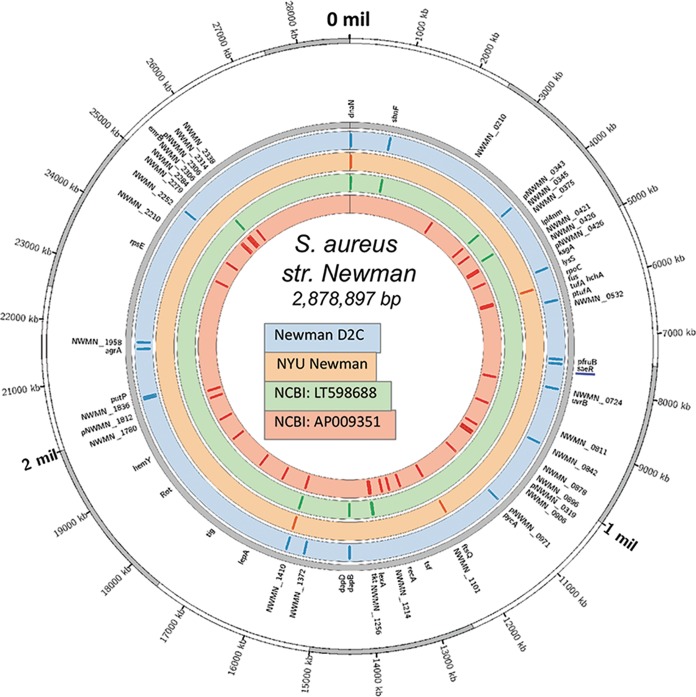
FIG 2.
Whole-genome sequencing reveals disparities between Newman D2C and NYU Newman. Illumina HiSeq2000 sequencing demonstrated crucial mutations in Newman D2C compared to NYU Newman. Shown is a visualization of S. aureus Newman genetic diversity on a circular map of the chromosome of the Newman reference strain AP009351. The first ring from the outside shows the scale of the chromosome in nucleotides. The second ring indicates the positions of mutated genes in the genome (gray). The next four circles illustrate the four genomes used in this study (Newman D2C, NYU, NCBI LT598688, and NCBI AP009351). The colored tiles inside each circle represent the positions of mutations within each respective genome.

