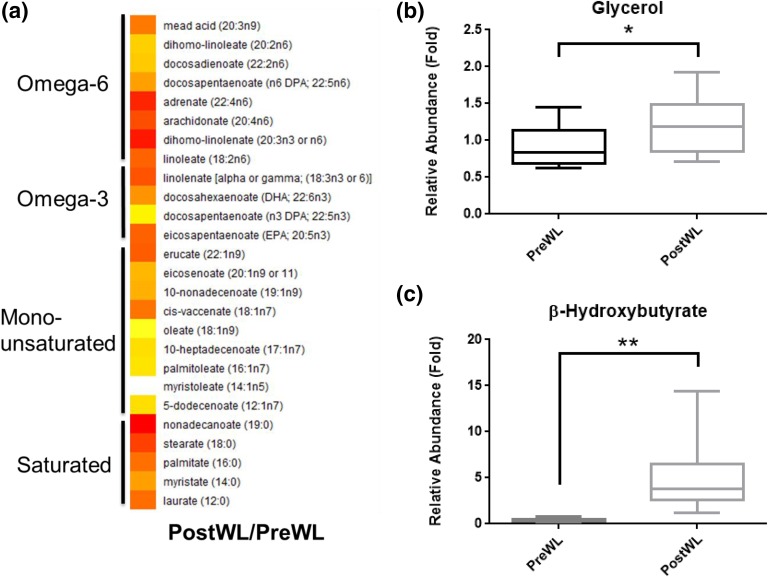
Figure 3.
Effects of VLCD-induced weight loss on levels of free fatty acids and glycerol in plasma. (a) Heat map comparing the ratios of plasma free fatty acid levels between postWL and preWL samples. White indicates unity, with yellow to red indicating increased levels. All free fatty acid species shown were significantly increased (P < 0.05). (b) Box plot of preWL and postWL abundance of plasma glycerol relative to total ion counts, and scaled by setting the preWL loss median to one (*P = 0.01). postWL, after weight loss; preWL, before weight loss.

