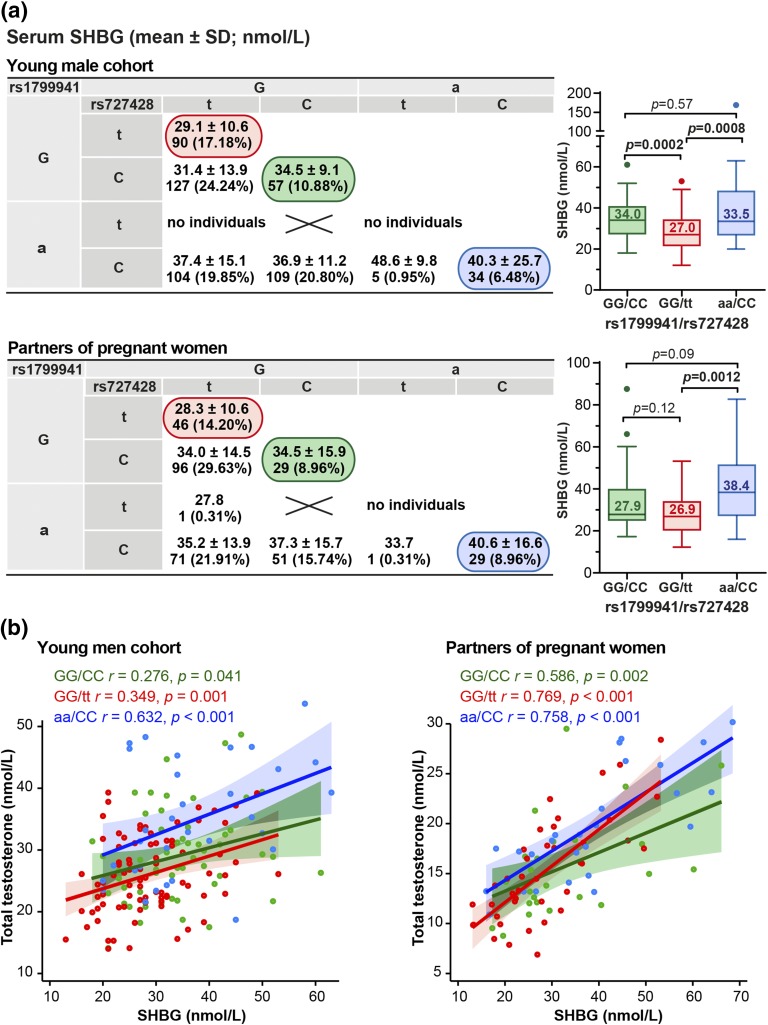
Figure 2.
Effect of the carrier status of SHBG rs1799941 (−68G/A; 5′UTR) and rs727428 (+1091 C>T; 3′downstream) genotype combinations on SHBG and total T levels in the study groups of young men (n = 540) and partners of pregnant women (n = 324). (a) SHBG levels in the nine possible SHBG genotype combinations formed by the −68G/A and +1091 C/T variants. Respective number of carriers is shown under the SHBG data presented as mean ± SD. The prevalence of each genotype combination (%) is shown in parentheses. Box plots show the genetic effect on double homozygotes of the two studied variants, rs1799941/rs727428 genotypes (GG/CC, green; GG/tt, red; aa/CC, blue). The numbers inside the boxes represent median values. Statistical significance between the groups was assessed by Mann-Whitney U test. (b) Scatter plots assessing correlations between SHBG and total testosterone levels in rs1799941/rs727428 genotype combinations GG/CC (green), GG/tt (red), and aa/CC (blue) from young men cohort and partners of pregnant women. Best-fit regression line, 5th to 95th confidence intervals, Pearson product-moment correlation coefficients (r), and significance of correlation (P) are shown.

