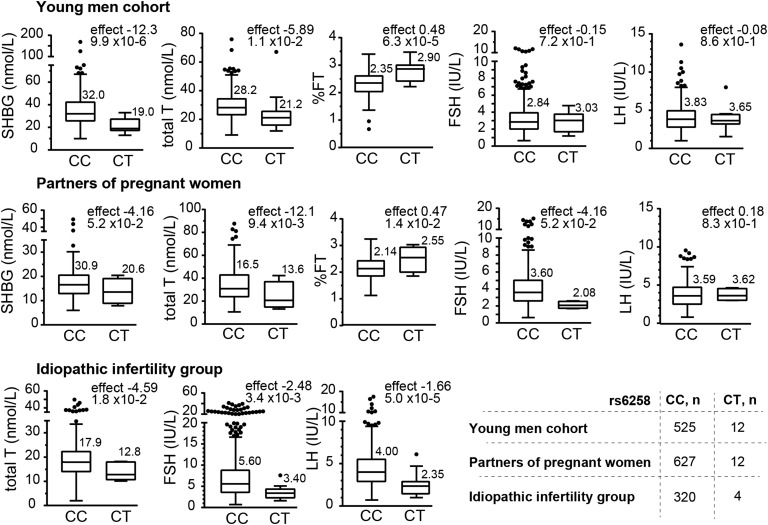
Figure 3.
Tukey boxplots for the distribution of the total testosterone, SHBG, and %FT values in the young men cohort (n = 540), partners of pregnant women (n = 324), and idiopathic infertility patient study groups (n = 641) stratified according to the genotypes of the SHBG gene variant rs6258 (C>T, Pro185Leu). The numbers above the boxes represent median values. Minor allele effect (statistic β from linear regression under additive model) and statistical significance (P value) are shown on each graph.

