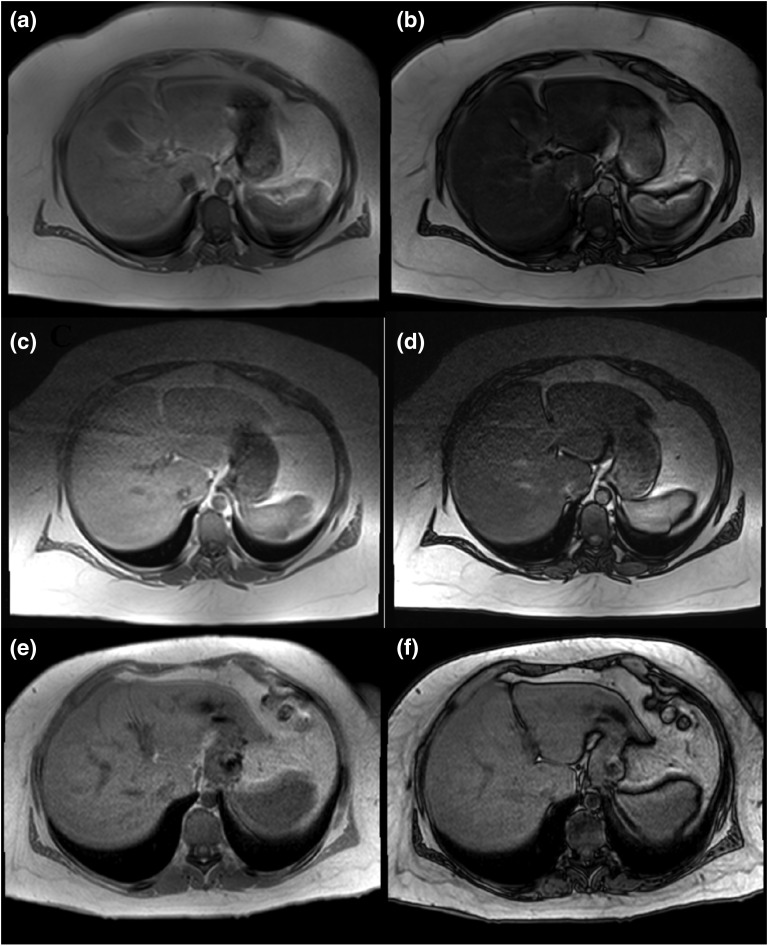
Figure 3.
MRS images before and after bariatric surgery. In-phase (a, c, e) and out-of-phase (b, d, f) images are shown at 9 months before surgery (a and b), 3 months before surgery (c and d), and 9 months after surgery (e and f). Substantial signal drop in the liver in out-of-phase images (b and d) indicates severe liver steatosis before surgery. Liver fat was 32.5% 9 months before surgery (b) and 31.6% 3 months before surgery (d) and decreased to 5.3% 9 months after surgery (f).

