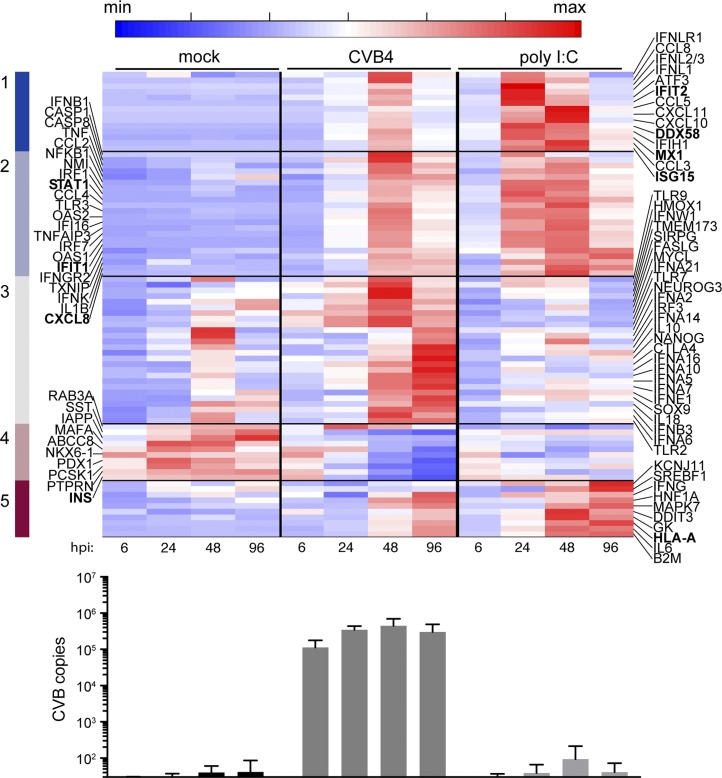
Figure 3.
Gene expression in cultured primary human islets following challenge with CVB4 or poly I:C. The heat map depicts the five clusters of genes that have at least twofold change compared with mock in the average of the four replicates. The color bar highlights five clusters obtained after k-means clustering. Genes in boldface are also found in Table 1. Averages for four independent human donors were used. Time points are indicated. Average CVB copies per condition, measured by NanoString, are shown in the bottom panel; error bars represent the standard deviation.

