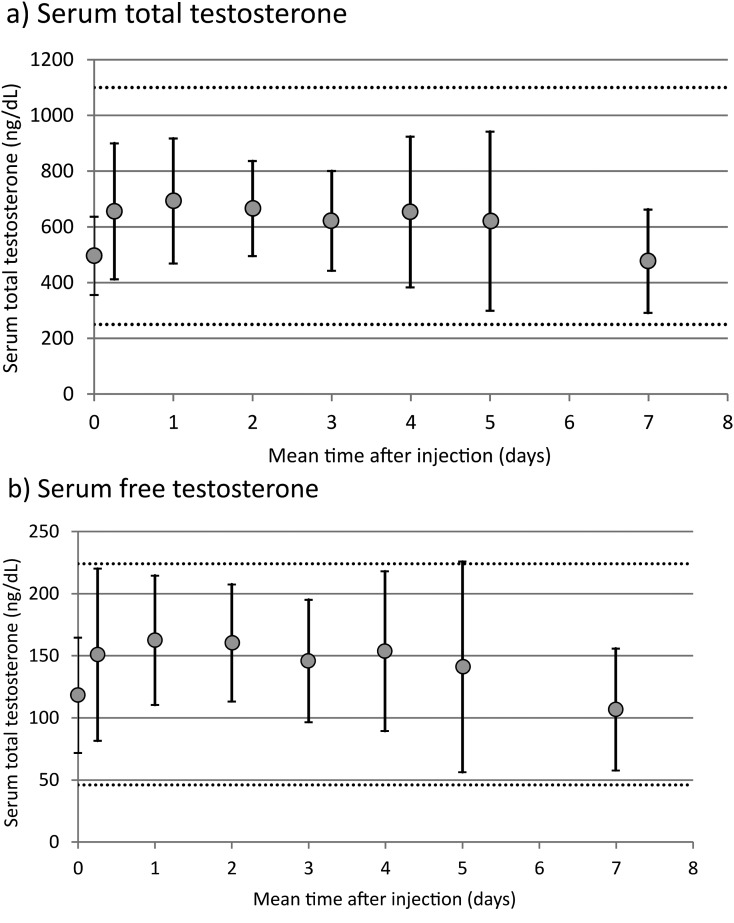
Figure 1.
Serum total and free testosterone over a 1-week treatment cycle. Serum measurements taken at 0 and 7 days were from samples drawn immediately prior to SC testosterone injection. Dashed lines represent the lower and upper values of normal range for each total free testosterone. Data are shown as mean ± standard deviation.

