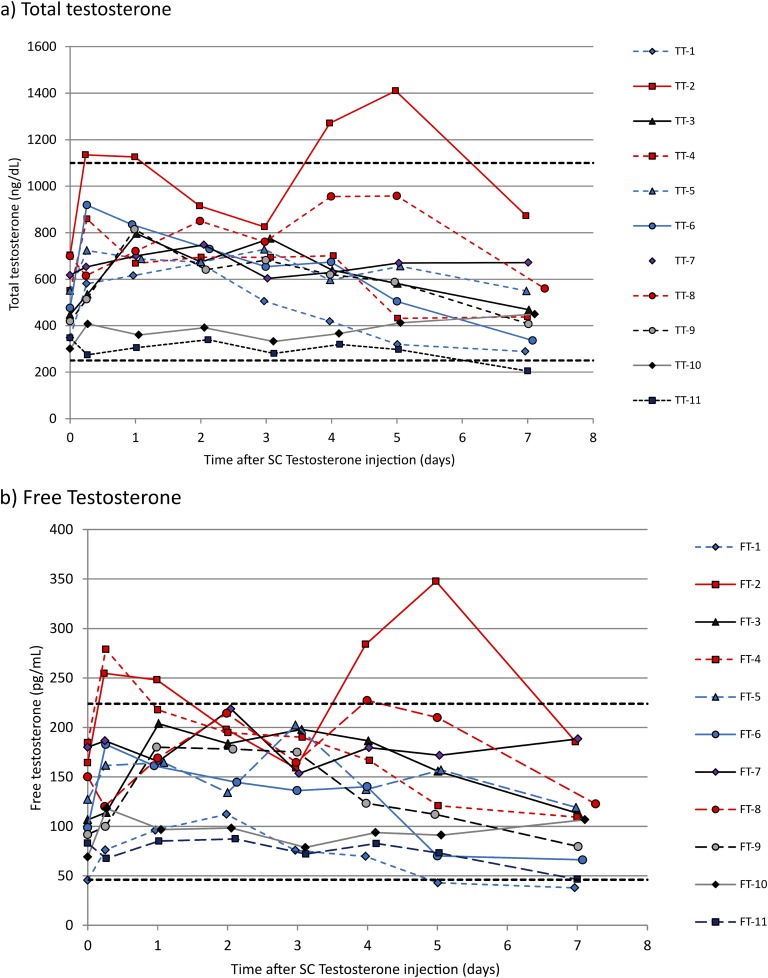
Figure 2.
Individual hormone levels over time after SC testosterone injection: 11 female-to-male transgender patients. Individual patients are identified by number in the key. Horizontal dashed lines represent the lower and upper limits of the normal male range for total and free testosterone. The three patients with the lowest serum testosterone concentrations were all receiving 50-mg doses, and the patient with the highest concentration was receiving a 100-mg dose. FT, free testosterone; TT, total testosterone.

