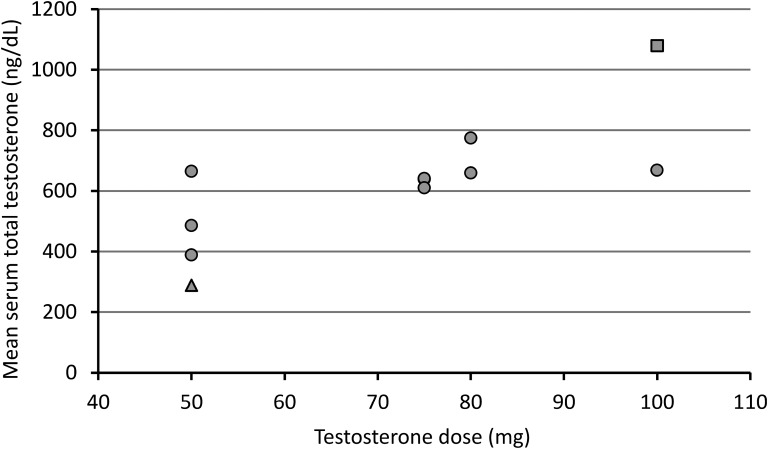
Figure 3.
The relationship between testosterone dose and mean serum total testosterone. Data are shown as mean serum total testosterone among measurements taken between testosterone injections. The closed triangle represents a patient with one serum total testosterone measurement below the normal male range during the study; the closed square represents one patient with four serum total testosterone measurements above the normal male range during the study.

