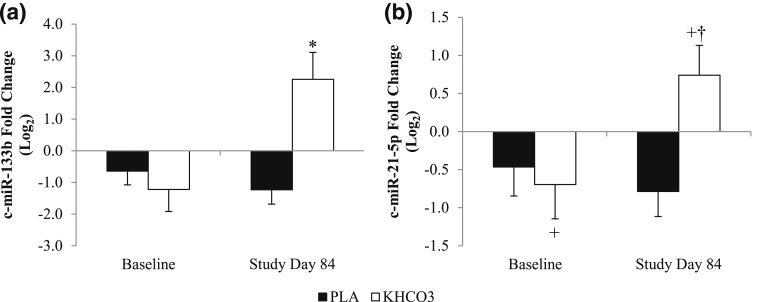
Figure 1.
(a) The 84-day change in expression of c-miR-133b by group. (b) The 84-day change in expression of c-miR-21-5p by group. Values are presented as mean ± standard error of the mean. *Time-by-treatment interaction; P < 0.05. +Trend toward main effect of treatment; P = 0.054. †Trend toward time-by-treatment interaction; P = 0.065. PLA, placebo.

