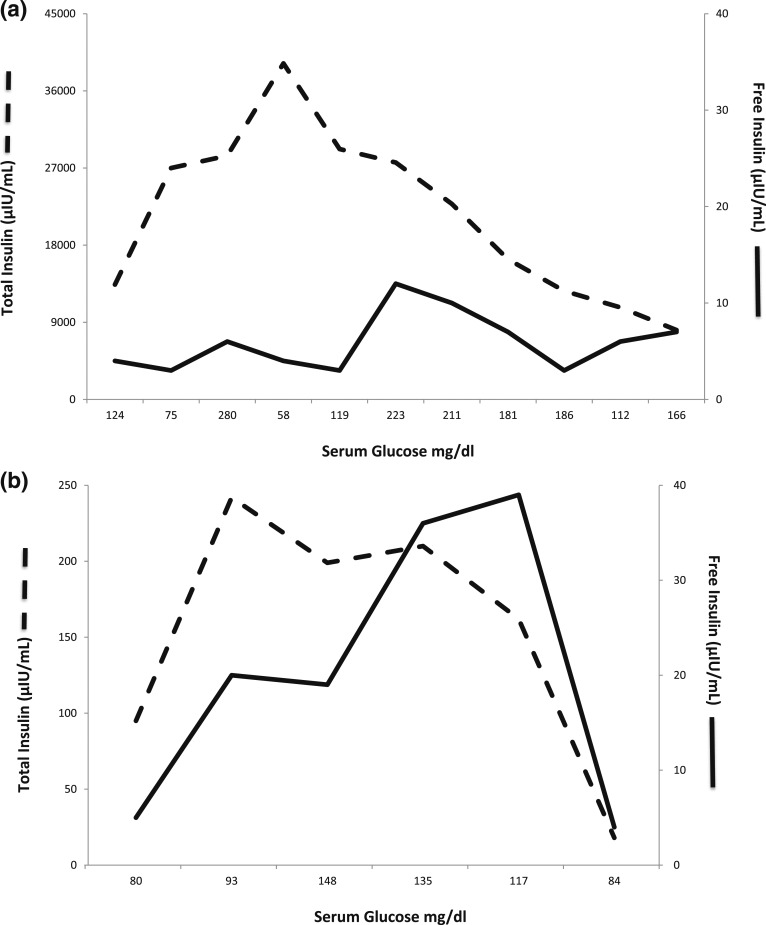
Figure 1.
(a) Levels of total insulin (dashed line) and free insulin (solid line) plotted against the corresponding serum glucose levels on x-axis prior to treatment. The graph shows that although the total serum insulin levels were consistently high, free insulin levels when determined by PEG precipitation were appropriate for ambient glycemia during the initial treatment phase. (b) Levels of total insulin (dashed line) and free insulin (solid line) plotted against the corresponding serum glucose levels on x-axis during the 3 months of observation after discontinuing glucocorticoids. The graph shows that the total serum insulin levels have greatly decreased (note different scale), although the levels were still higher than free insulin levels. The latest levels are quite comparable with glucose of 84 mg/dL.

