Figure 2.
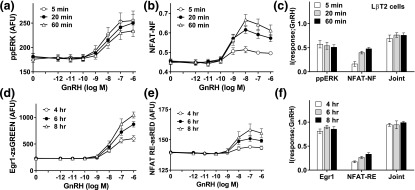
Joint sensing of ERK and NFAT signaling in LβT2 cells. For (a)–(c), LβT2 cells transduced with Ad NFAT-EFP were continuously stimulated 5, 20, or 60 minutes with 0 or 10−12 to 10−6 M GnRH as indicated before being fixed, stained (DAPI and ppERK), and imaged for ppERK and NFAT-NF as described for Fig.1, except that in this case both were measured in identical cells. The single-cell data from the full concentration response curves were then used to calculate MI between GnRH concentration and each response (ppERK or NFAT-NF) and also the joint MI between GnRH and both responses (Joint). For (d) and (e), LβT2 cells transduced with Ad Egr1-zsGREEN and Ad NFAT RE-asRED were stimulated for 4, 6, or 8 hours with 0 or 10−12 to 10−6 M GnRH as indicated before being fixed, stained (DAPI), and imaged to quantify zsGREEN and asRED. The single-cell data were then used to calculate MI between GnRH and the expression level for each reporter and also the joint MI between GnRH and both reporters (Joint). The data shown are means ± standard error of the mean (n = 5 to n = 7) for population-averaged measures of ppERK (a), NFAT translocation (NFAT-NF, b), Egr1-driven zsGREEN expression (d), and NFAT RE-driven asRED expression (e), as well as I(response;GnRH) (c and f) in bits. Log EC50 values for (a) were −8.24 ± 0.07, −8.01 ± 0.08, and −7.76 ± 0.16 (n = 7) at 5, 20, and 60 minutes, respectively, and one-way analysis of variance revealed that time was not a significant source of variation (P > 0.05).

