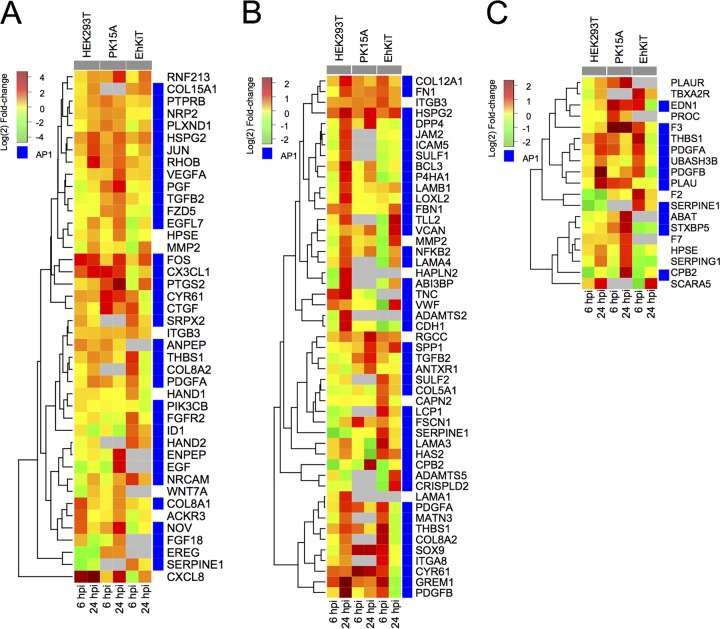
FIG 4.
Expression dynamics of significantly differentially expressed genes involved in angiogenesis (GO:0001525) (A), extracellular matrix organization (GO:0030198) (B), and regulation of coagulation (GO:0050818) (C). Each tile represents the mean log2 fold change in regulation from three independent biological replicates. Gray tiles represent genes that were not identified within the PK15A or EhKiT cell line or had an infinity fold change (i.e., no reads at 0 hpi). Blue tiles represent genes which had one or more AP1 binding sites within their promoters.

