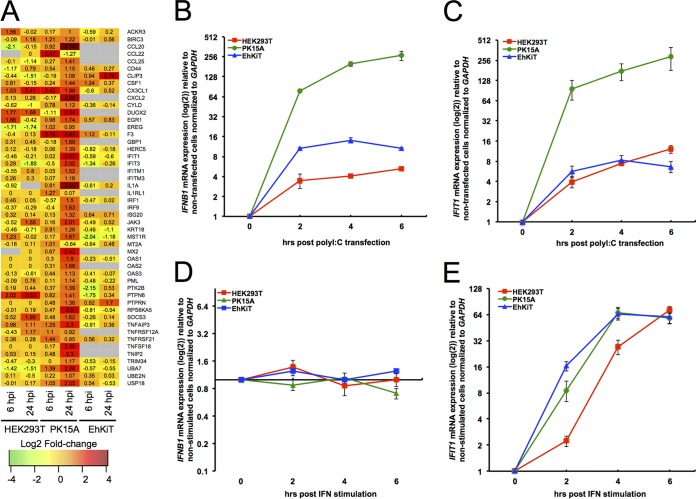
FIG 5.
Comparison of interferon response across cell lines. (A) Heatmap representation of individual genes contributing to the enriched GO term cytokine-mediated signaling pathway (GO:0019221). Each tile represents the mean log2 fold change in regulation from three independent biological replicates. Gray tiles represent genes that had no human ortholog or had an infinity fold change (i.e., no reads at 0 hpi). (B and C) Relative IFNB1 (B) and IFIT1 (C) mRNA expression (as the log2 fold change) for HEK293T, PK15A, and EhKiT cells following transfection with poly(I·C) for 2, 4, and 6 h. The mean ± standard error from three biological replicates is presented, with each replicate being performed as a duplicate PCR. (D and E) Relative IFNB1 (D) and IFIT1 (E) mRNA expression (as the log2 fold change) for HEK293T, PK15A, and EhKiT cells following treatment with type I universal interferon (IFN). The mean ± standard error from three biological replicates is presented, with each replicate being performed as a duplicate PCR.

