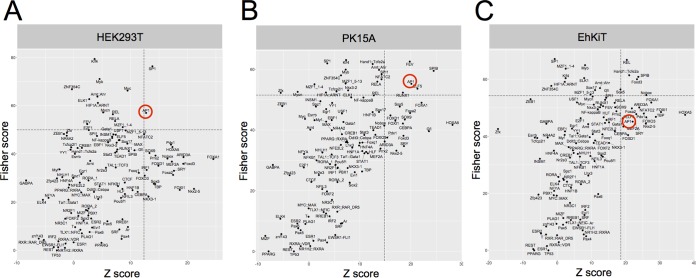
FIG 6.
Transcription factor binding site (TFBS) analysis of upregulated gene sets. The overrepresentation of TFBS in the genes upregulated in HEK293T (A), PK15A (B), and EhKiT (C) at 24 hpi is indicated. The significance of enriched TFBS was assessed by combining the Z-score and the Fisher score. Dashed lines represent the mean + 1 standard deviation of the Z-score and the Fisher score for all TFBS. The AP1 transcription factor is circled in red.

