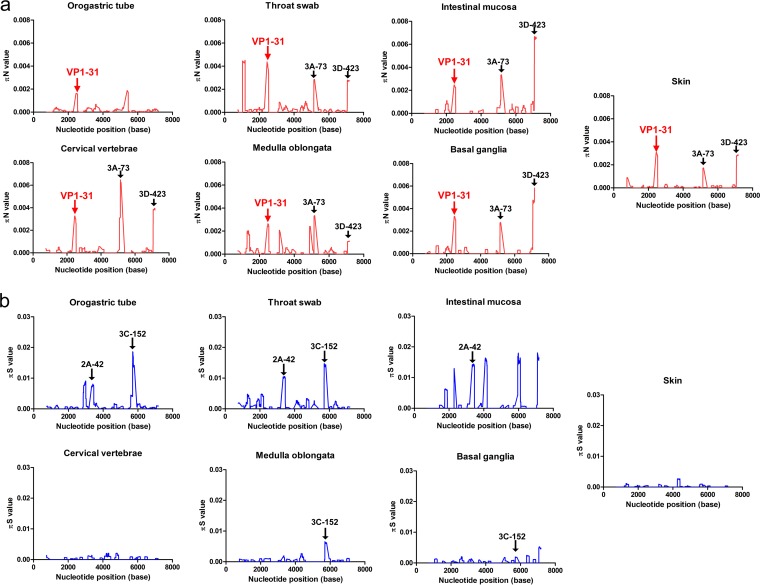
FIG 3.
Genetic-diversity contributions of nonsynonymous and synonymous mutations of viruses isolated from various tissues. The πN (a) and πS (b) values were calculated throughout each viral genome using a 50-codon sliding window and a 1-codon step. High πN/πS values indicate cases where the SNVs evolved under positive selection, whereas low πN/πS values indicate SNVs that evolved under purifying selection. Amino acid residues for the major peaks of πN and πS are noted in the plots. The arrows indicate the πN peaks of the VP1-31, 3A-73, and 3D-423 residues and πS peaks of 2A-42 and 3C-152 residues among different specimens or tissues, respectively.

