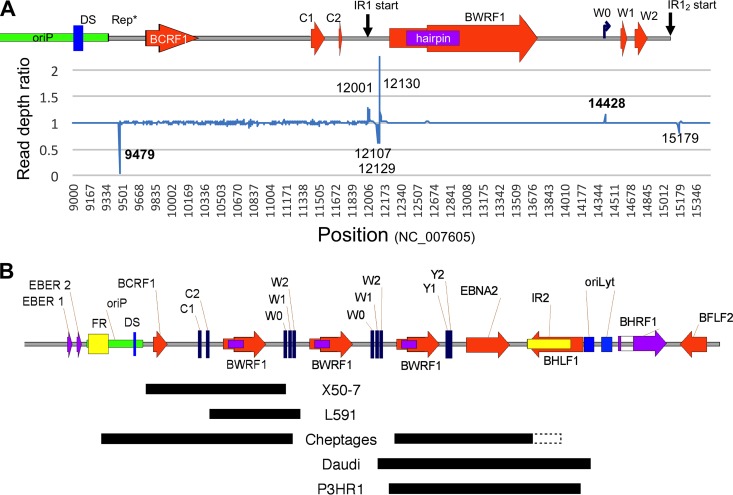
FIG 2.
Characterization of strains with deletions affecting IR1. (A) Read depth analysis. The graph shows read depth ratios at adjacent nucleotides from X50-7 reads mapped against the prototype EBV genome (accession number NC_007605) on the y axis, with the EBV genome position shown on the x axis. The schematic above the graph shows positions of genomic features. Numbers in the graph show positions for the RDA signal peaks, and those in bold show the edges of the X50-7 deletion. (B) Schematic representation of deletions that include parts of IR1. A black box indicates the position of the deletion; a dotted box indicates uncertainty over the position of the deletion, as the junction lies within a repetitive region. Positional details for these deletions are found in Table 1. For scale, note that there are 3,072 bp between identical features in the repeat.

