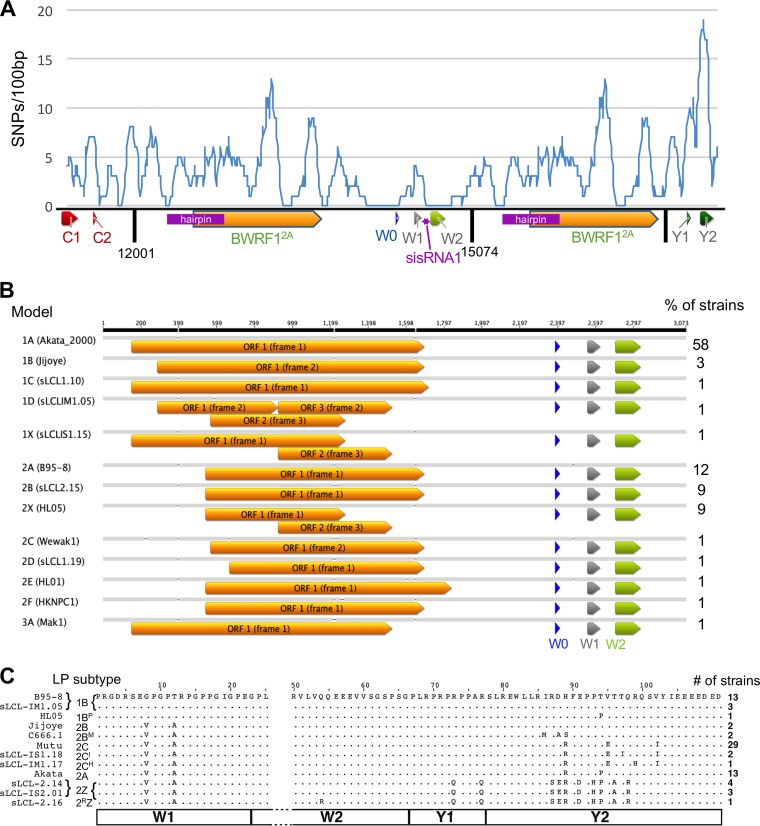
FIG 3.
Polymorphisms in IR1, BWRF1, and EBNA-LP. (A) Distribution of polymorphisms (SNPs found in more than 1 strain) in IR1. SNP counts in a 100-bp sliding window are shown against their positions in the IR1 template. In the schematic, arrows indicate positions of exons/ORFs, and dark vertical lines represent edges of IR1 repeat units. (B) Visualization of all ORFs of over 600 nucleotides across the BWRF1 region of IR1. Since there are no AUG start codons in most of the BWRF1 region, ORFs are defined at their maximum possible length (i.e., maximum distance between stop codons). The frequency of each model (percentage) is shown to the right. (C) Amino acid sequence variants of the EBNA-LP protein encoded by the viruses. All sequences are shown relative to the B95.8 consensus (dots indicate no change). The protein subtype according to the nomenclature proposed here (with the commonest subtypes in bold) (Table 2) and the name of an example strain are given to the left. The number of unrelated strains (out of 74 total strains) encoding each variant is shown to the right (see Table ST1 in the supplemental material for strain-specific information). Numbers at the top indicate amino acid positions (according to a W1W2Y1Y2 exon structure), with amino acids 26 to 49 omitted (gap in sequence) because they are identical in all strains. The exon structure is shown by the boxes at the bottom of the panel.

