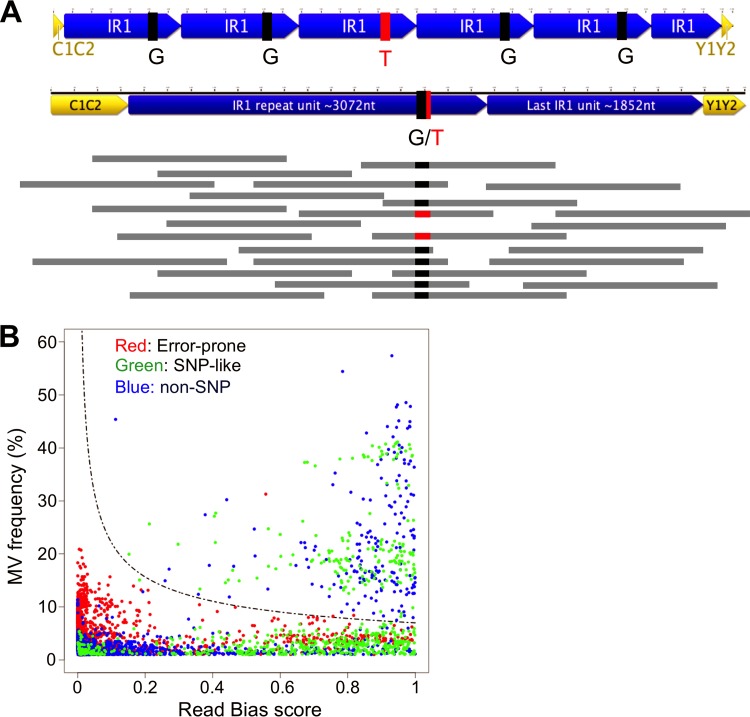
FIG 5.
Defining minor variants. (A) Visual representation of the nature of minor variants (MVs), explaining their identification. The top section shows a repeat region in which 1 of 5 repeat units contains the minor variant T rather than the consensus G. If the reads (horizontal gray bars) from sequencing of this repeat are mapped against the consensus template (the representation of IR1 containing 1.6 repeats), 80% of reads will be G (black), but 20% will be the minor variant T (red). (B) Defining a threshold for calling minor variants. The graph plots the read bias (x axis) against the MV frequency (y axis) for every potential MV with a frequency of >1% across 76 strains. Red points are potential MVs at positions that show an elevated MV frequency in all strains (error-prone positions). Green points are MVs that are seen as SNPs in at least one strain. All other MVs are represented by blue points. The dashed line represents the cutoff above which we accepted the MVs as likely to be genuine, based on the following equation: . Potential MVs that were designated SNPs in the flanks of IR1 were excluded.

