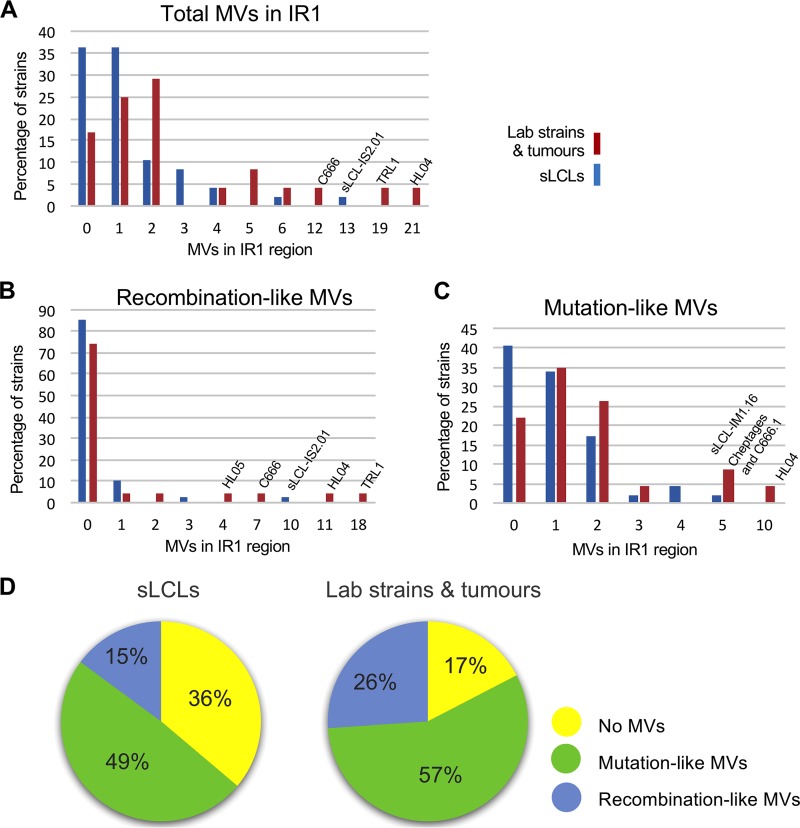
FIG 6.
Minor variant diversity in spontaneous LCLs compared to that in tumor-derived samples. Graphical representations show the number of minor variants in the IR1 repeat region in each independent strain (defined in Materials and Methods). Samples were grouped as being either spontaneous LCLs (including one saliva-derived sequence) (blue bars) or tumor-derived samples (red bars). The number of MVs is shown on the x axis, and the y axis shows the percentage of strains with each number of MVs. Graphs display total MVs (A), MVs that resemble SNPs (recombination-like MVs) (B), and MVs that resemble spontaneous mutations (mutation-like MVs) (C). (D) Pie charts indicating the types of genetic variations found in EBV IR1 from the sLCL and tumor groups. The type of variation was classified as either homogeneous repeats (yellow), at least one recombination-like MV (blue), or only mutation-like MVs (green).

