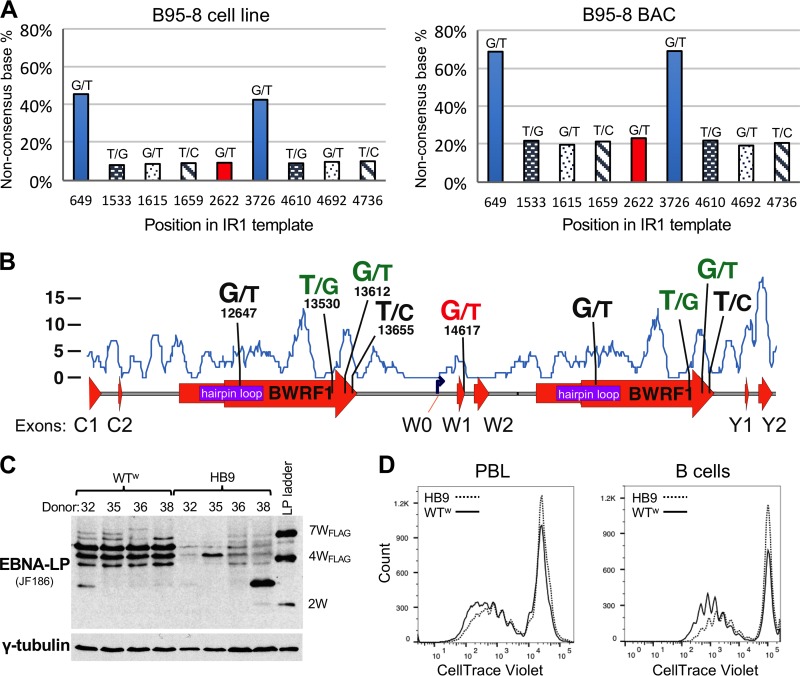
FIG 9.
Minor variants in IR1 of the prototype EBV strain B95-8. (A) Graphs showing MV frequencies across the template sequence of IR1 of B95-8. The sequence variations are shown with the base of the published B95-8 sequence at left and that of the newly identified variant at right, with the y axis showing the frequency of the newly identified nucleotide. The x axis shows the position of that variant in the IR1 template multiple-sequence alignment (see Supplemental Data SD1 in the supplemental material). Note that this means that the alternative nucleotide at position 649/3726 is the dominant allele in the HB9 BAC-based genome (right). At other positions, the different frequencies of MVs are due to different numbers of IR1 repeat units between the B95-8 cell line (11.6 repeat units) and the HB9 clone of the B95-8 BAC (6.6 repeats). (B) Graphical representation of the B95-8 MVs relative to major features of IR1. For each MV, the left base indicates the published nucleotide and the right indicates the alternative variant, with the numerical position in the first repeat unit of the prototype EBV sequence (NC_007605) given below. Bases in green indicate changes that have been observed as SNPs in other strains. The “G/T” pair in red indicates the stop codon in W1 introduced by the MV T nucleotide at that position. The blue line and y axis indicate the SNP density (from Fig. 3A) across the repeat for comparison. (C) Western blot comparing EBNA-LP levels and sizes in LCLs 30 days after infection of four independent donors, using either the original B95-8 EBV BAC (HB9) or a recombinant BAC from which all MVs were removed (WTw). The EBNA-LP ladder is from 293 cells transfected with three differently sized EBNA-LP variants: the number of W1W2 domains in each band plus any tag is indicated to the right. The blot was stripped and reprobed with a gamma tubulin antibody as a loading control (lower panel). (D) Flow cytometry traces showing dilution of the CellTrace Violet stain on B cells 8 days after infection, comparing equal cell numbers for the WTw (solid line) and parental HB9 (dotted line) strains. The y axis shows the cell count, and the x axis shows the log10 CellTrace Violet fluorescence intensity. The left plot is for CD19+ (gated) live cells infected as mixed lymphocytes, and the right plot is for CD19-purified B cells infected and grown in the absence of other cells, based on data also published elsewhere (49).

