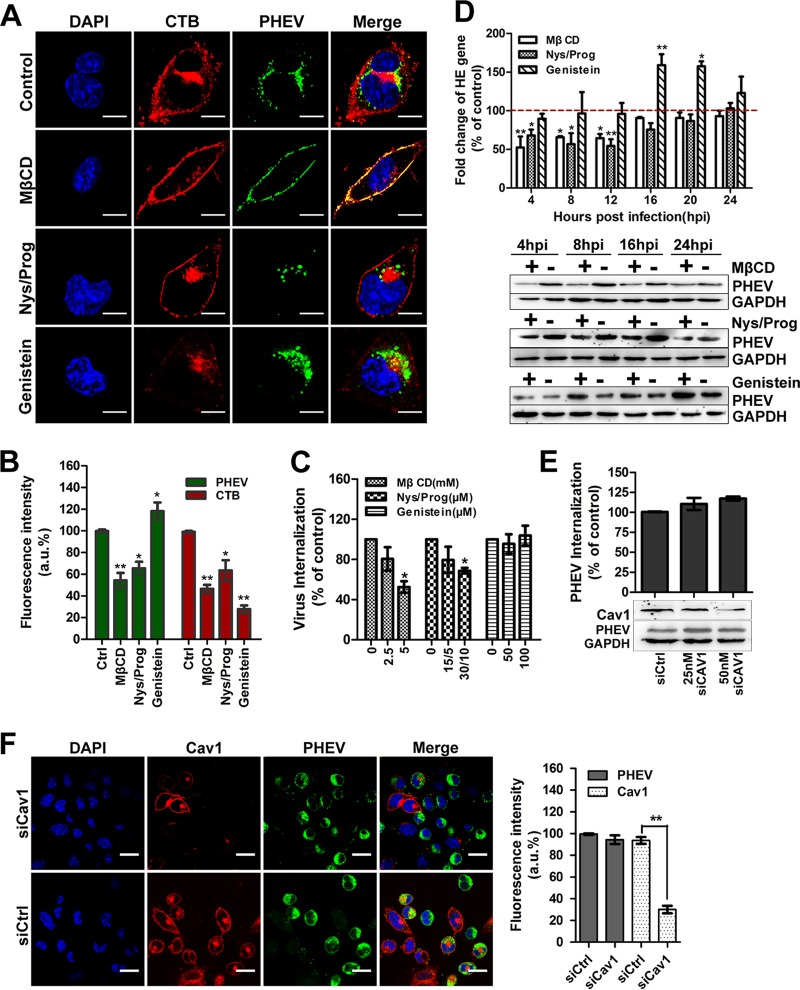
FIG 5.
PHEV propagation depends upon cholesterol fluidity but does not involve caveola/raft-dependent endocytosis. (A) PHEV entry was assessed in cells treated with DMSO (control), MβCD (5 mM), Nys/Prog (30/10 μM), or genistein (100 μM) for 60 min. Following binding on ice, PHEV was allowed to internalize at 37°C for 60 min. Surface-bound virus was removed, and the cells were fixed and visualized by use of a confocal microscope. (B) Quantitative results for the average PHEV and CTB fluorescence intensities in cells pretreated with pharmacological inhibitors are presented in a histogram. (C) PHEV internalization after treatment of Neuro-2a cells with the indicated agents for 1 h was quantified by qRT-PCR. Data are shown as percentages of PHEV uptake compared to that of control-treated cells. (D) PHEV infection assays were carried out with MβCD-, Nys/Prog-, and genistein-treated cells. PHEV genome equivalents were estimated by qRT-PCR, using the 2−ΔΔCT method, while viral protein synthesis levels were estimated by Western blotting with anti-PHEV-S antibody. GAPDH was used as a loading control. (E) A PHEV uptake and propagation assay was carried out with siCav1-transfected Neuro-2a cells. Infected cells were lysed to quantitate viral RNA copy numbers by qRT-PCR, and the silencing efficiency of siCav1 was analyzed by Western blotting using anti-caveolin-1 antibody. (F) The lack of involvement of the caveola/lipid raft-mediated route was demonstrated by the stability of PHEV infection in siCav1-transfected cells. Pretransfected cells were incubated with PHEV for 24 h to allow virus propagation. The cells were then fixed, stained with anti-Cav1 (red) and anti-PHEV (green) antibodies, and visualized by confocal microscopy. Data shown are means ± SD for three independent experiments. *, P < 0.05; **, P < 0.01. Bars, 10 μm.

