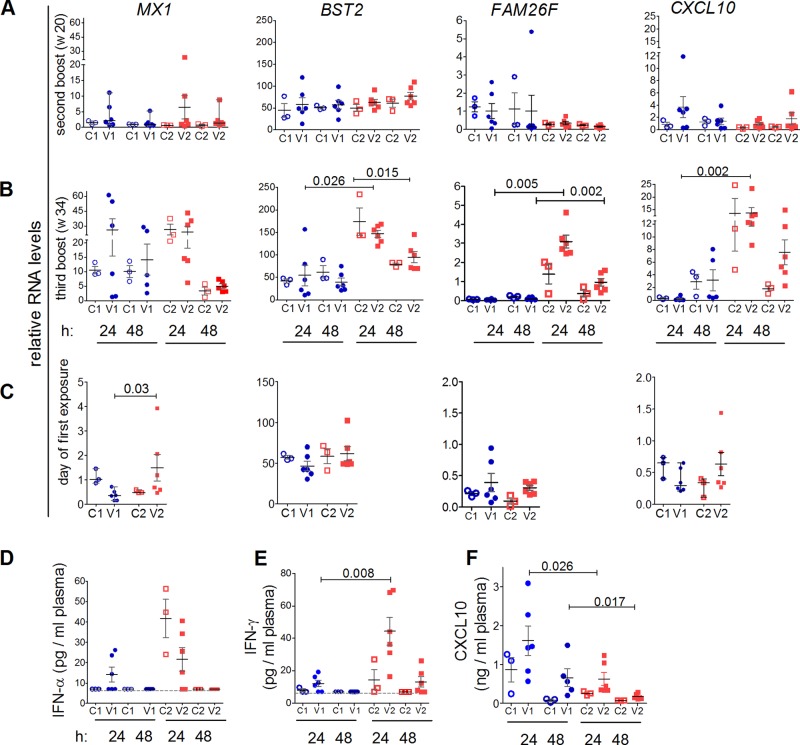
FIG 7.
Innate immune responses 24 and 48 h after second (week 20) and final (week 34) booster immunizations and on the day of first challenge. C1, controls for V1; C2, controls for V2. Data for V1 are shown in blue and those for V2 in red. Significant P values discriminating V1 and V2 are shown (Mann-Whitney test). Means and standard errors of the mean are depicted for each group. (A to C) Relative RNA levels of MX1, BST2, FAM26F, and CXCL10 in PBMCs at 24 and 48 h after the second booster (A) and the third booster (B) immunization and on the day of first SIV exposure (C). (D) Plasma IFN-α was assessed by a panspecific IFN-α ELISA at 24 and 48 h after the third booster immunization. The cutoff value (7 pg/ml) is shown by the dashed line. (E) Plasma IFN-γ at 24 and 48 h after the third booster immunization was determined by macaque-specific ELISA. Plasma IFN-γ levels of all control samples and of V1 obtained at 48 h after the final immunization were below the detection limit of the assay (7 pg/ml). (F) Plasma CXCL10 was determined by a macaque-specific ELISA at 24 and 48 h after the third booster immunization (week 34).

