FIG 6.
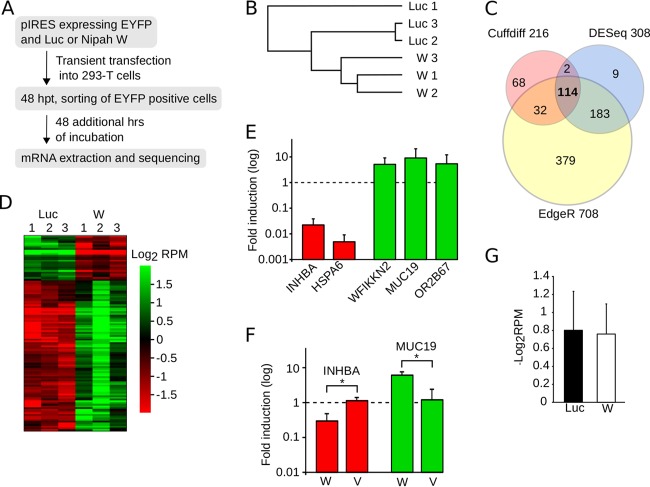
Nipah virus modulation of gene expression. (A) Flowchart representation of the mRNA extraction and purification protocol. (B) Pearson correlation analyses of the sequenced samples. This analysis included the expression profiles of all of the genes. (C) Venn diagram indicating the number of differentially expressed genes comparing Nipah virus W and luciferase samples, identified by CuffDiff (pink), DESeq2 (light blue), and EdgeR (yellow). (D) Heat map of the values of log2 reads per million (RPM) for the 114 differentially expressed genes detected by all three algorithms. (E) qRT-PCR validation of RNA-seq data. The bar graph shows the fold induction provoked by the expression of W protein over the luciferase values. Error bars represent the standard deviations from three replicates. (F) qRT-PCR measurements of INHBA (red) and MUC19 (green) mRNAs, selected as examples of genes down- and upregulated, respectively, by the Nipah virus W protein. In these experiments, cells were transfected with luciferase (reference sample) and expression plasmids for either the W or V protein. After 48 h, mRNAs were extracted and measured by qRT-PCR. The bar graph shows the fold induction of mRNA achieved in the presence of either the W or V protein over values recorded for luciferase. Error bars indicate the standard deviations from three replicates. Significance (t test) was calculated by comparing the V and W samples. *, P < 0.05. (G) Average log2 RPM values for the Luc and W samples.

